

 i
iExperienced practitioners are anecdotally aware of the growth in recent years in the volume of health care qui tam litigation. That perceived trend is validated quite graphically in the most recent Department of Justice (“DOJ”) statistics on False Claims Act filings. The annual DOJ report, released on December 3, tracks annual recoveries and investigations for various categories of False Claims Act cases. The DOJ statistics also break down cases and recoveries between investigations brought by the government and actions filed by qui tam relators.
The statistics go back to 1987, allowing an analysis of trends in False Claims Act litigation over the past 28 years. What the statistics reveal is that health care-related cases – specifically, privately-instituted health care-related qui tam cases – have overwhelmingly been the largest factor in the growth in False Claims Act cases and recoveries over the past twenty years. Graphing those statistical trends over time creates clear and striking visuals that illustrate the impact of the two-decade long explosion in health care qui tam litigation.
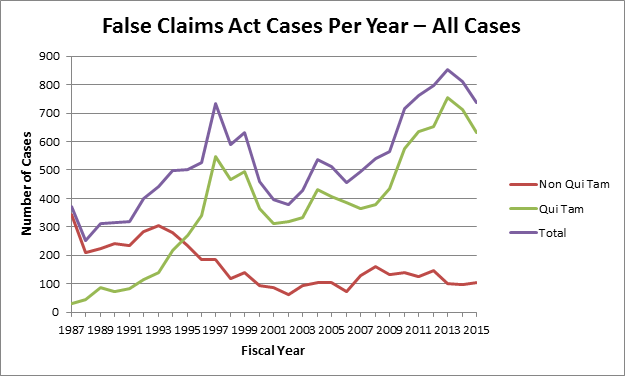
Starting with the DOJ statistics for all False Claims Act cases commenced between 1987 and 2015, the first trend that is apparent is the preponderance of privately-instituted cases since 1995. In that year, the number of new qui tam filings first exceeded the number of government False Claims Act cases. Over the next 20 years the absolute number of government matters declined, even as the total number of new False Claims Act cases trended upward, with surging private litigation activity more than offsetting the reduced number of government referrals and investigations. As this first graph illustrates, the growth in False Claims Act litigation since 1995 is entirely a function of qui tam litigation. The process of identifying and pursuing claims under the False Claims Act has functionally been provided by private counsel.
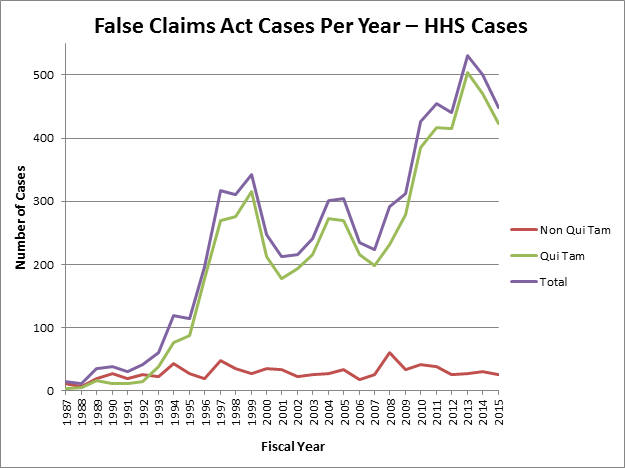
Even more striking over that time is the steep growth in filings in cases that DOJ classifies as involving the Department of Health and Human Services (“HHS”). These cases, consisting primarily of health care-related claims, have grown from close to zero in 1987 to over 400 cases per year since 2011. And, as was the case for overall False Claims Act litigation, the growth trend is largely a function of privately-filed claims. While the volume of government referrals and investigations involving HHS has basically flat lined for almost 30 years, qui tam filings surged past government filings in 1992, accounting for the steep increase in the total number of health care-related False Claims Act cases filed since then.
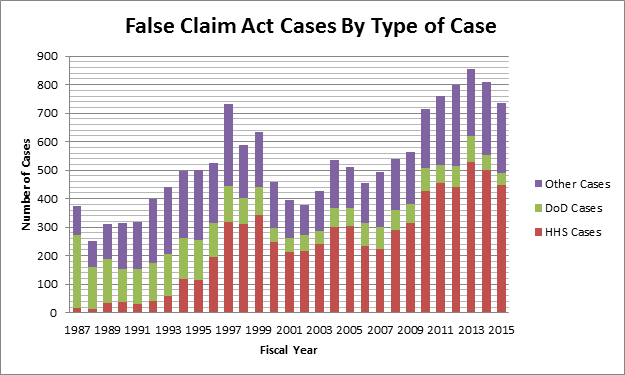
Unsurprisingly, this rapid growth in health care-related filings has driven the growth in overall False Claims Act litigation. As this bar chart illustrates, Department of Defense (“DOD”) cases predominated in the late 1980s, a trend consistent with burgeoning levels of defense spending at the end of the Cold War. But over the ensuing years, the number of HHS-related cases rapidly grew as health care spending came to represent a larger portion of both the U.S. economy and state and federal budgets. By the late 1990s, HHS cases constituted a majority of all False Claims Act cases, with subseqent growth in HHS-related filings translating directly to growth in overall False Claims Act litigation. And, since the growth in HHS cases has been driven solely by increasing qui tam filing volume, the resulting growth in overall False Claims Act volume is itself a function of privately-instituted health care-related False Claims Act cases.
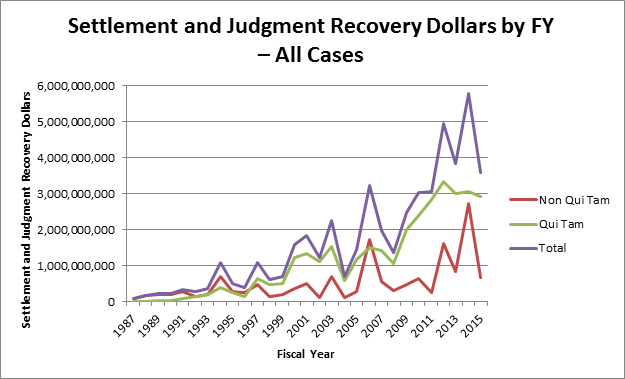
So what about the money? The statistics for recoveries in all False Claims Act cases suggest that the government gets a significant bang for its buck in the cases that it brings. And, in contrast to flat or declining volume in the absolute number of government referrals, overall recoveries in government filed cases over the entire period from 1987 to the present have trended upward.
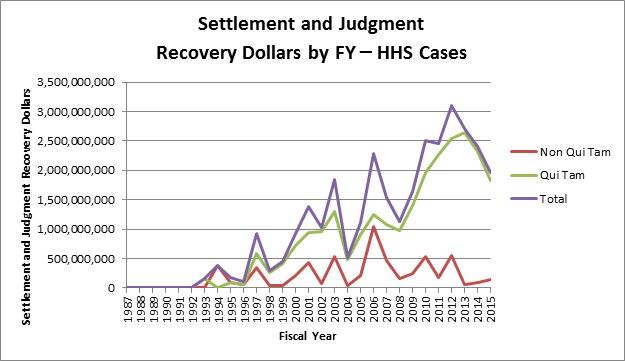
But looking only at recoveries in HHS cases, it appears that the relatively large recoveries in government-instituted cases have predominately occurred in non-HHS cases. In all years except 2006, the graph for total recoveries in HHS cases is virtually identical to the graph for qui tam recoveries. This indicates that for most of the past ten years, about 80% of all health care-related False Claims Act recoveries has resulted from qui tam lawsuits. In this sector, at least, the recovery dollars are driven primarily by privately-instituted claims.
The relationship between health care qui tam filing volume and the growth in health care qui tam recoveries poses a “chicken and egg” problem. Are the recoveries a function of filing volume, or are growing numbers of filings attracted by the size of the recoveries? Perhaps a bit of both, although answering that question would require a depth of analysis beyond the scope of this piece. Whatever its cause, the growing volume in health care qui tam cases has been no illusion. It has become the most significant portion of all False Claims Act litigation, both in terms of cases filed and dollars recovered, and will continue to warrant significant attention by the fraud and abuse defense bar.