
 i
iI’ve been tracking the EEOC’s charge filing statistics for several years now. These statistics have created quite a database of filings going all the way back to 1997. Every year, usually in February when the statistics are released, I’ve analyzed the data to assess the latest trends. This year threw a bit of a monkey wrench into that routine, since February came and went with no statistics being published. No matter – a few months late, the numbers finally are out. So, how are things trending?
The agency reports that 76,418 charges were filed last year. This may sound high, but it is significantly less than the totals reported in recent years. It’s also lower than the total number of charges reported more than 20 years ago in 1997 (80,680) when there was a smaller workforce. In fact, we haven’t seen numbers this low since 2005-2006.
My working theory is that the filing of charges waxes and wanes with the health of the overall economy: if things are purring along and it is easy for employees to move around, then the number of charges goes down; when a recession hits and employment is harder to find, the numbers spike up.
Historically, this can be seen with a sharp increase in charges surrounding the bursting of the dot-com bubble and 9/11, and later with the 2008 recession. Given the overall health of the economy nowadays (with record low unemployment numbers), I’m happy to report that the latest figures seem to continue to support the theory that relatively good times equate to fewer filings.
But enough with words. Here is an illustration of how the total number of charges have changed over time going back to 1997:

As you can see, the 2018 numbers depict a continued sharp decline from a recent spike in 2016. Numerically, this amounts to approximately 15,000 fewer filings last year versus 2016, and about 8,000 fewer filings versus 2017.
The reduction in numbers is frankly a bit surprising given the prominence of the #MeToo movement in recent years and the extremely polarized political climate and heightened awareness of discrimination and harassment. As a result, my prediction from last year that we would not likely return back to the floor seen in 2005-2006 has been well and truly squashed. This is why I don’t gamble.
Turning to specific types of charges, and particularly sex discrimination claims, the numbers – frankly – continue to surprise. Below is a depiction of where things now stand with the added 2018 figures:
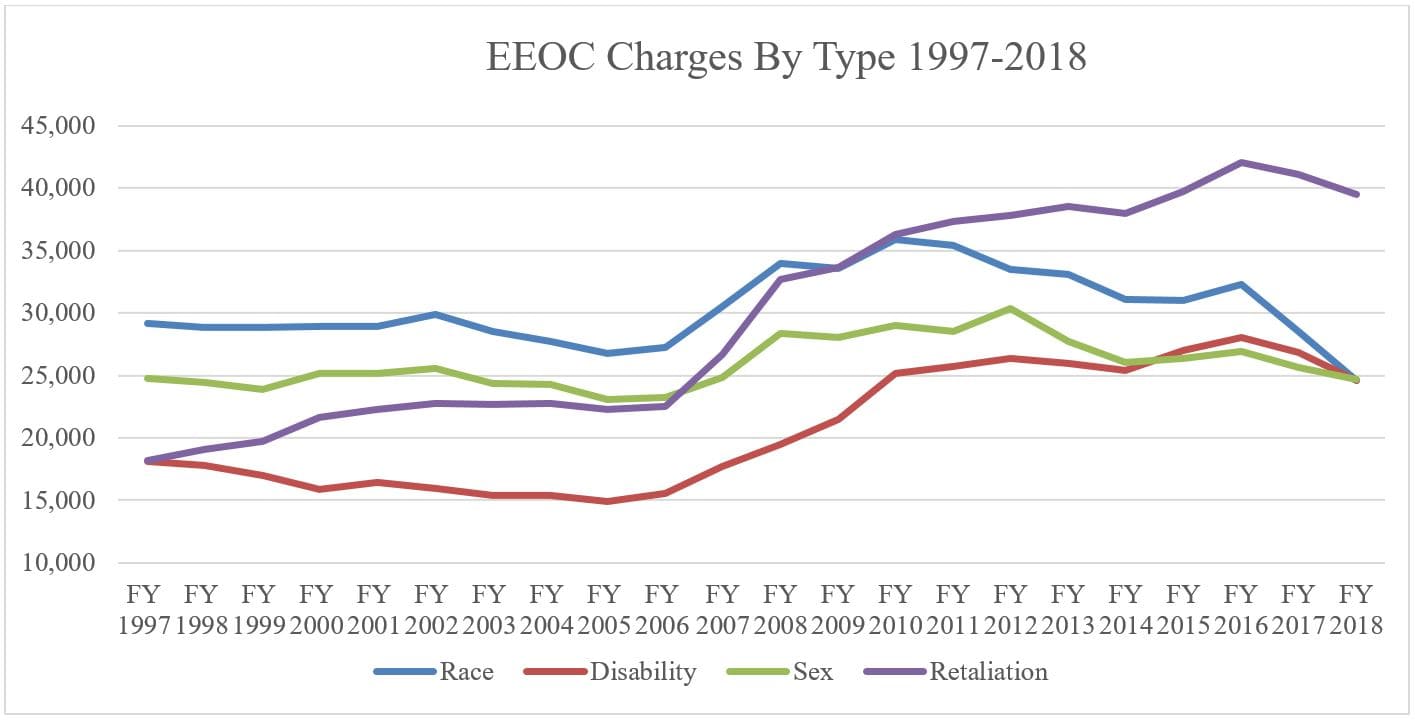
The number of overall sex discrimination claims has dropped from last year and from the year before. This decline is consistent with the general trend, but again is a little surprising considering the heightened awareness of sexual harassment in the workplace.
If anything, these numbers indicate that despite media reports and a focus on high profile cases, there hasn’t been a corresponding increase in people filing sex discrimination claims. Indeed, the opposite is true – the numbers of sex discrimination claims are continuing to trend downwards.
The data also shows that race and disability claims are continuing to fall, along with retaliation claims (which, however, still lead the pack in terms of filings).
One thing which doesn’t appear on this chart is Genetic Information Nondiscrimination Act (GINA). The reason is simple – last year only 220 claims were filed under that act, far below the scale of this chart. While the current count of GINA claims represent a slight increase from 2017 (206 charges), the numbers for this type of claim have never been high. In fact, since 2010 when GINA first appeared, the total number of claims in a single year has never gone higher than 333. Looking back over almost a decade of data, it is fair to say that GINA simply has not made the splash that many employer-side attorneys feared when the act first was rolled out.
Turning back to the retaliation numbers, while these have been trending down along with the other filings, the fact that this is the most frequently filed type of claim still is jarring. Employers must take extra care to adopt anti-retaliation policies and make sure to enforce those policies if and when employees come forward to report potential claims.