


 i
iFalse advertising litigation typically revolves around two questions:
1. Did the allegedly false advertising have any impact on purchasing behavior?
2. If it did, what was the defending brand’s unfair gain?
In preparing for litigation, attorneys often employ consumer research experts to answer the first question and damages experts, i.e., economists, forensic accountants, corporate finance professionals, etc., to answer the second question.
This article describes a consumer research methodology that not only detects the presence of impact, but is also capable of quantifying the potential gain associated with allegedly false claims.
The Setting
|
Depending on the product category, exposure to ads may cause preference shifts favoring one brand versus another that may lead to purchases or immediate behavioral shifts. For example, in response to an ad carrying allegedly false claims, a consumer might buy the brand right away and develop a preference lasting beyond the current purchase. Let’s use an example in which the plaintiff — a company suing alone or a group of consumers acting as a class — argues that the defendant has been using four false claims on its packaging and on its website. In its suit, plaintiff argues that those false claims are likely to affect consumers’ choice behavior by shifting their preference and causing its brand to lose sales to defendant’s brand. This is the typical setting for false advertising claims. |
Exposure to ads may cause reference shifts favoring one brand versus another that may lead to purchases or immediate behavioral shifts. |

The Research Design
The methodology proposed here employs a test vs. control design using samples of the defending brand’s customers (e.g., bought in the last X number of months). None of the products are branded in the test.
The test brand is represented by a complete list of attributes or benefits, including those contested in the litigation as being false or misleading. The control product lists the same attributes less the allegedly false claims or including versions of the claims using language that would not have caused the plaintiff to launch the suit in the first place.
The design is implemented via an online survey of defendant’s customers. Survey respondents in both groups are instructed to imagine themselves shopping for the product category using the list of attributes as a cue and to indicate their preference by choosing a point on the 5-point purchase likelihood scale shown below.
Very likely to buy — Somewhat likely to buy — Neither likely nor unlikely to buy —
Somewhat unlikely to buy — Very unlikely to buy
The Gain Factor
The proportion of respondents who rate the brand in the top two boxes, i.e., very and somewhat likely to buy, obtained in the test and control groups are categorized as customers who prefer the brand described by the list of attributes presented to them. Based on these results we can derive a gain factor due to the alleged false advertising using the formula:

The formula states that the gain accruing to the defendant’s brand is equal to the net impact of the falsely advertised content as a proportion of the preference caused by the allegedly false advertising.
The gain factor answers the question: What proportion of the preference for the misleading brand is due to the false claims made in its marketing communication? For example, if the preference in the test group turns out to be 47 percent and the preference in the control group is 20 percent, then the gain factor is calculated as:

This result indicates that the false advertising being contested here is responsible for 57 percent of the total preference of the allegedly infringing brand.
|
False advertising litigation aims to put a dollar figure on the purportedly ill-gotten revenue of the offending brand.
Plaintiffs can develop reliable estimates of the direct effect of the allegedly false advertising on consumer preference for the defendant’s brand. |
DiscussionFalse advertising litigation aims to put a dollar figure on the purportedly ill-gotten revenue of the offending brand. Ideally, that determination should be based on an exact accounting of the number of units sold because of the false advertising multiplied by the price paid by customers. Recognizing the impossibility of such accounting, litigants’ forensic experts use various approximations based on derived correlations, historical data, analogies drawn from other product categories, etc., all of them attempting to come as close as possible to the prevailing reality. The advantage of the method proposed here is that, based on data obtained directly from consumers, plaintiffs can develop reliable estimates of the direct effect of the allegedly false advertising on consumer preference for the defendant’s brand. Based on the strong correlation between preference and purchase, a central tenet of consumer behavior studies, we can use the preference results to estimate purchasing behavior. The empirical question facing the finder of fact is the strength of the correlation or association between preference and actual purchase. That decision process should be aided by the logical analysis presented in Table 1. The relationship between preference and purchase can be presented in a 2X2 matrix that results in four possible states, two of which are self-explanatory. They cover the situations when someone prefers and buys the brand or when someone does not prefer and does not buy the brand. The other two quadrants represent situations that are contradictory in nature: people who prefer the brand but do not buy it, or people who buy the brand in spite of not preferring it. Table 1 lists the possible reasons for those “anomalies.” If people who prefer the brand do not buy it, it is most likely because of the price differential relative to other brands or because the brand is not available where they happen to shop. Conversely, if the brand is not on top of their preference list, they may still buy it because the price is attractive or because the brand is the only one available where they shop. |
Table 1 The Relationship Between Preference and Purchase
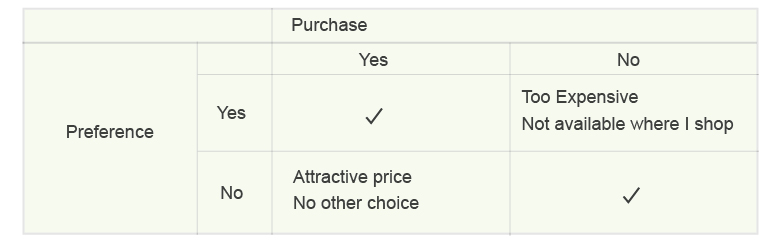
This boils down to two main reasons for behavior deviating from preference: availability and price. Otherwise, one would expect to see complete congruence between preference and purchasing. Neither limited availability nor unreasonable price should create a significant difference between preference and purchase in a developed economy with a robust competitive environment.
Based on that, it appears that in the long-run, the brand preference data obtained in surveys can be applied directly to the “ill gotten” revenue estimation at the heart of damages calculations.
Summary
While consumer research cannot directly estimate the transfer of sales, revenue, or profits from one brand to another or the supposedly ill-gotten profits that may be due to false claims, it can estimate the preference shift due to the points communicated by the allegedly false advertising compared to an identical bundle of benefits that does not contain the disputed benefits. As discussed above, preference gains constitute a valid measurement of purchasing.