


 />i
/>iAs noted in the main article, four categories of offenses represent over 80% of the total national caseload: immigration, drugs, firearms, and fraud-related financial offenses. Here’s a closer look at the categorical data from FY2018*.
Immigration
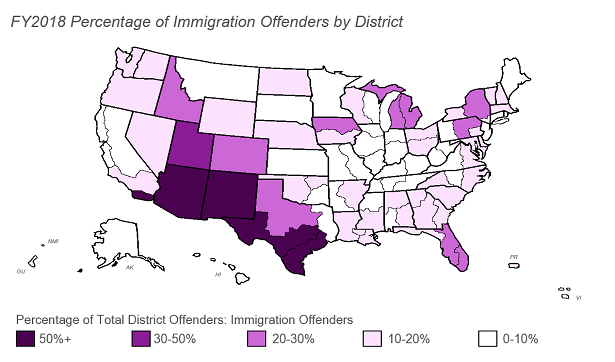
Most of the FY2018 immigration offenders come from what DOJ calls the “Southwest border districts”: the Districts of Western Texas, Arizona, New Mexico, Southern California, and Southern Texas. In FY2018, 75.8% of the immigration offenders nationwide came from these five districts combined. More than 2/3 of the total cases from these five districts are immigration offenders. Western Texas had the largest individual number of immigration offenders of any district nationwide, with 8,087 offenders. This figure represents almost 1/4 of all immigration offenders nationwide and over 11% of the total national caseload for all offenses during FY2018. That said, while Western Texas produced the largest number of immigration offenders, New Mexico had the highest proportion of its caseload come from immigration offenders – 83.2%. This percentage represents an all-time high for a single offense category within one district since the Commission began reporting these statistics in FY1990. In contrast, the average percentage of immigration offenders for the other eighty-nine districts was 12.0% of the district’s caseload.
As you can see from the map below, there were five districts where immigration offenders made up more than half of the district caseload: Arizona; Southern California; New Mexico; and Western and Southern Texas. An additional eleven districts had offender caseloads that were more than 20% immigration: Colorado; Middle and Southern Florida; Idaho; Northern Iowa; Eastern and Western Michigan; Northern New York; Middle Pennsylvania; Northern Texas; and Utah.
With respect to districts nationwide:
-
Sixty-nine districts saw FY2018 increases in the percentage of immigration offenders within their total district caseloads when compared with FY2017 numbers. Conversely, twenty-two districts saw decreases in the FY2018 percentage of immigration offenders within their total district caseloads; three districts stayed the same.
-
Of those sixty-nine districts with increases, nineteen saw the overall percentage of immigration offenders in the total district caseload double (or more) during FY2018 when compared with FY2017: Middle and Southern Alabama; Eastern Arkansas; Southern Georgia; Hawaii; Eastern Kentucky; Western Louisiana; Maine; Montana; Eastern North Carolina; Eastern Oklahoma; Middle and Western Pennsylvania; Eastern and Western Tennessee; Western Virginia; the Virgin Islands; Southern West Virginia; and Eastern Wisconsin.
-
There were sixteen districts in which immigration offenders made up fewer than 5% of the district caseload: Alaska; Connecticut; the District of Columbia; Guam; Northern and Central Illinois; Northern and Southern Indiana; Minnesota; Eastern and Western Missouri; Southern New York; Eastern Oklahoma; Western Tennessee; Northern West Virginia; and Eastern Wisconsin. The only district that did not have an immigration offender in FY2018 was Alaska.
Drug Trafficking Offenses
Of the FY2018 drug offenders, 96% were convicted of drug trafficking offenses, so we will limit our discussion to those offenders. The top five districts for FY2018 drug trafficking offenders were the same as those for immigration: Southern California, Arizona, New Mexico, Western Texas, and Southern Texas. In FY2018, the drug trafficking offenses from these five districts made up 28.0% of the drug trafficking offenders nationwide. Southern California had the largest number of drug trafficking offenders of any district, with 1,392 offenders convicted of drug trafficking offenses. Western Virginia’s drug trafficking numbers as a percentage of the district caseload were the highest, as 58.8% of its offenders were convicted of drug trafficking offenses. This figure is the highest percentage of drug trafficking offenders for a single district since FY2016, when 68.1% of Vermont’s offender caseload involved drug trafficking offenses.

With respect to districts nationwide:
-
Thirty-nine districts saw FY2018 increases in the percentage of drug trafficking offenders within their total district caseload when compared with FY2017 numbers. Fifty districts saw the percentage of drug trafficking offenders decrease during FY2018, while five districts stayed the same.
-
Seven districts had caseloads that were more than 50% drug trafficking offenses: Western Arkansas; Connecticut; Hawaii; Eastern Kentucky; Rhode Island; Vermont; and Western Virginia.
-
Eighty-five of the ninety-four districts have total caseloads with at least 20% federal drug offenders. The only district where drug offenders made up less than 10% of the total district caseload was New Mexico (9.9%).
Firearms
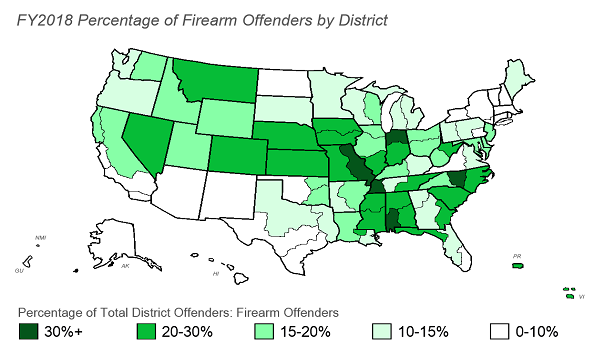
The districts with the greatest number of firearms offenders in FY2018 were Western Texas, Eastern Missouri, South Carolina, Southern Texas, and Western Missouri. The firearms offenders from these five districts made up 16.7% of the firearms offenders nationwide in FY2018. Western Texas had the largest number of firearms offenders, with 288 offenders. All of these districts have active crime prevention programs that focus on prosecuting “the worst of the worst” firearm offenders – these programs fall under the umbrella of DOJ’s Project Safe Neighborhoods initiative.
Nationwide, Middle North Carolina’s FY2018 firearms numbers as a percentage of an individual district caseload were the highest, with 38.5% of its offenders were convicted of firearms offenses. This figure is the highest percentage of firearms offenders for a single district since FY2017, when 43.8% of Northern Indiana’s caseload involved firearms offenses.
With respect to districts nationwide:
-
See below* for information about the recategorization of firearms offenses.
-
Eight districts had caseloads with less than five percent firearms offenders: Arizona; Southern California; Guam; New Mexico; the Northern Mariana Islands; Vermont; and Southern and Western Texas. Five of these eight are the Southwest Border districts with very heavy immigration offender numbers. The Northern Mariana Islands was the only district without a firearms offender.
Fraud and Related Financial Offenses
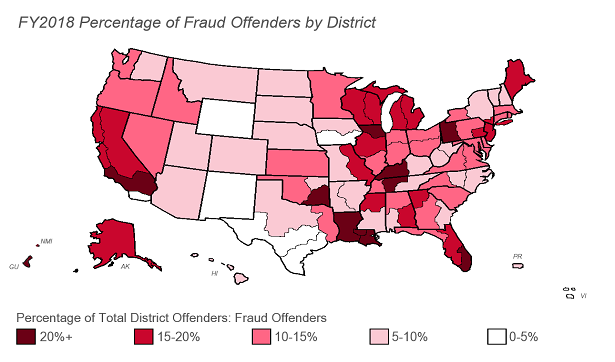
The top five districts for fraud offenders in FY2018 were Southern Florida, Central California, Arizona, Southern New York, and Middle Florida. In FY2018, the fraud-related offenders from these five districts made up almost one-quarter of fraud-related offenders nationwide. For the second year in a row, Southern Florida had the largest number of fraud-related offenders of any district, with 535 offenders in FY2018. The reasons for the large number of fraud offenders in these districts vary; for example, while Central California (Los Angeles) and Southern New York (Manhattan) are national financial centers; the Florida districts have multiple locations where Medicare strike forces operate.
In districts with at least twenty fraud offenders, Central California’s fraud numbers as a percentage of the individual district caseload were the highest, with 27.8% of its offenders convicted of a fraud-related offense. Expanding the review to include all districts, there were thirteen other districts with caseloads of at least 20% fraud offenders.
With respect to districts nationwide:
-
Thirty-five districts saw FY2018 increases in the percentage of fraud offenders within the total district caseload when compared with FY2017 numbers; fifty-four districts had decreased percentages, while five districts stayed the same.
-
There were seven districts with total caseloads that were fewer than five percent fraud offenders: Southern California; Southern Iowa; New Mexico; Southern and Western Texas; the Virgin Islands; and Wyoming.
-
Part of the reason for the decline in fraud offender numbers is that districts that used to have heavy fraud caseloads no longer do. There are seven districts where the FY2018 percentage of fraud offenders has decreased by 50% or more from the ten-year average percentage for FY2008-2017: Southern Alabama; Southern Iowa; Southern Mississippi; Western Missouri; New Hampshire; Western Texas; and the Virgin Islands. These declines in fraud offender numbers can also be attributed to the zero-sum nature of DOJ resources; as fraud offender numbers in these districts have gone down, the number of immigration and/or drug trafficking offenders in those districts have gone up.
*The Sentencing Commission announced in the FY2018 Sourcebook that it changed several methodologies in its statistical analyses of federal criminal offenders. One change it made was how it categorized offenders by the type of crime. Previously, the Commission used the statute of conviction to determine the type of crime; the count of conviction with the highest statutory maximum drove the primary offense category. For example, if an offender was convicted of a drug offense and a related firearm offense, the offender was categorized under the firearm offense since that crime has a higher statutory maximum penalty. With the FY2018 statistics, though, the Commission has moved to using the sentencing guideline with the highest offense level (how the federal courts classify crimes according to the severity of the offense) to determine the type of crime.
For the FY2018 Sourcebook, the Commission also recategorized the FY2017 offender numbers using this change in methodology. This retroactive change produced notable differences in some of the offender numbers. For example, the change resulted in an increase in the number of offenders categorized as having committed federal murder offenses during FY2017 from 72 to 354. The largest change came in cases with firearm offenses; the FY2017 firearms offender numbers dropped by over 1,300 offenders after the recategorization. This dramatic change was largely due to the recategorization of offenses involving the use or carrying of a firearm while committing another crime (such as a drug trafficking crime or a crime of violence); previously, those offenders were categorized as having committed firearm crimes, but they are now categorized in connection with the underlying crime of conviction to which the firearm crime was connected. Whenever we specifically refer to FY2017 data, we are going to use the recategorized data found in the FY2018 Sourcebook.
Notably, the Commission only provided recategorized numbers for FY2017. As a result, it is often not possible to make direct comparisons of FY2018 statistics with those from earlier years that were not produced with the current methodologies. In this article, we discuss the crimes contained in the four largest offense categories. Of these four major categories, however, only firearms had a marked shift under the new methodology; the other major offense categories did not have the same level of disparities. The FY2017 immigration offender numbers, for example, only increased by 0.4% from 20,421 to 20,496 offenders after the recategorization. Given the smaller changes seen in the immigration, drug, and fraud offense categories, we are comfortable noting the change in methodology and continuing to compare FY2018 data with that of years prior to FY2017 (the most recent year with the recategorized data). For those earlier years, it is admittedly not a perfect comparison, but it will still illustrate the general trends we are seeking to describe here. We also note that, in the FY2018 Sourcebook, the Commission often makes generalized comparisons of FY2018 offender numbers with offender numbers from previous years. So we are following suit with their approach.
More information on the recategorization is available on pages 28-31 in the Introduction to the FY2018 Sourcebook and in the section of Appendix A (the descriptions of datafiles and variables) addressing how the Commission defines the types of crimes. Thanks very much to the Sentencing Commission’s Office of Research and Data for its time and effort in providing additional insight into these changes.