

 />i
/>iThe United States Sentencing Commission has issued its 2018 Sourcebook of Federal Sentencing Statistics. The Sourcebook is an annual collection of data related to the federal criminal cases that resulted in an offender being sentenced during a fiscal year (“FY”). This year’s edition (for FY2018) presents the data from the first full fiscal year of the Department of Justice under the Trump Administration. `The FY2018 Sourcebook covers the criminal caseloads of the ninety-four United States Attorneys’ Offices, as well as the criminal work of the Department of Justice (“DOJ”) components, such as the Fraud Section and the Tax Division. This article is the first in a series that will explore the statistical side of Trump’s DOJ and its prosecutorial priorities. In the coming weeks, we will take a deeper dive into offense, demographic, and other statistics from the Sourcebook and other data sources.
Before getting into the case numbers, here’s an overview of the kinds of criminal cases DOJ prosecutes. First, there are crimes of exclusive federal jurisdiction – crimes that only the federal government can charge. These include counterfeiting United States currency and unlawfully entering the United States. What ordinarily would be state crimes will fall within exclusive federal jurisdiction when they occur on federal property – land in Indian Country, for example, or within the “special maritime and territorial jurisdiction of the United States,” which includes the “high seas” and military bases, among other places.
Second, there are crimes of concurrent jurisdiction – conduct that can be prosecuted either by states or federally. For instance, if an offense begins in one state and continues into another, federal law enforcement can obtain jurisdiction over what would ordinarily be a state crime. So states could prosecute an interstate kidnapping under state law, but federal prosecutors have jurisdiction over it as well. Federal authorities also have jurisdiction over crimes that involve an instrument of interstate commerce. An example here is wire fraud involving the use of telecommunications channels (such as phone lines or the internet), which can be prosecuted either under a state’s fraud laws or under federal law.
In addition to following DOJ initiatives that focus on specific kinds of offenses, federal prosecutors typically base decisions about whether to prosecute a concurrent jurisdiction crime on the seriousness of the crime and the dangerousness of the offender – what many federal prosecutors describe as targeting the “worst of the worst .” Federal prosecutors also consider whether more than one state proceedings involving related conduct would be inefficient or problematic. One example is the federal prosecution of members of the “Felony Lane Gang” who traveled from state to state engaging in fraud. Federal prosecutors took these cases because having multiple state court proceedings would involve the unwieldy transfer of defendants from state to state for each case, could result in witnesses having to travel to multiple states to testify, would take far longer to complete than a single federal prosecution, and could result in lesser punishments or duplicative restitution orders.
In FY2018, the rankings for the most-sentenced federal offenses were generally the same as in recent years. In order of prevalence, the top-ranked offenses were those involving immigration, drugs, firearms possession, and fraud-type conduct.
The Sourcebook includes information on all offenders sentenced during FY2018 for federal felonies (punishable by more than a year) and Class A misdemeanors (punishable by more than six months but no more than a year). The Sourcebook does not include information about lesser misdemeanors and infractions.
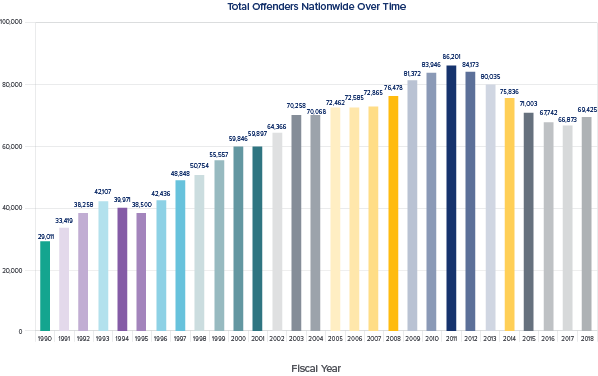
The Sourcebook contains information about 69,425 offenders from FY2018. Here’s an overview of those statistics as a whole:
-
There were 2,552 more offenders sentenced in FY2018 than in FY2017 (66,873), an increase of 3.8%. This was the first increase in the total number of federal offenders since FY2011.
-
Even with the increase in offenders, FY2018’s numbers are still below those of most recent years. While FY2018’s offender total was the highest since FY2015 (when there were 71,003 offenders), it was only the eighth largest in the last ten years. Since the Commission began reporting sentencing data in FY1990, DOJ’s high-water mark for the number of offenders was in FY2011, with 86,201 offenders.
-
Of the offenders sentenced in FY2018, 67,610 pleaded guilty to one or more offenses with which they were charged – a rate of 97.4%. This is the highest percentage of guilty pleas in federal cases since the Commission began reporting data. The lowest guilty plea rate was in FY1991 (85.4%). The percentage of guilty pleas in federal cases has grown steadily since that time.
-
Around 95.7% of FY2018 offenders were sentenced for felonies, while 4.3% were sentenced for misdemeanors. The FY2018 percentage of felony offenders is slightly lower than that of FY2017 (when 96.6% of offenders were sentenced for felonies), but the FY2018 numbers are largely consistent with the level at which federal courts deal with felony cases.
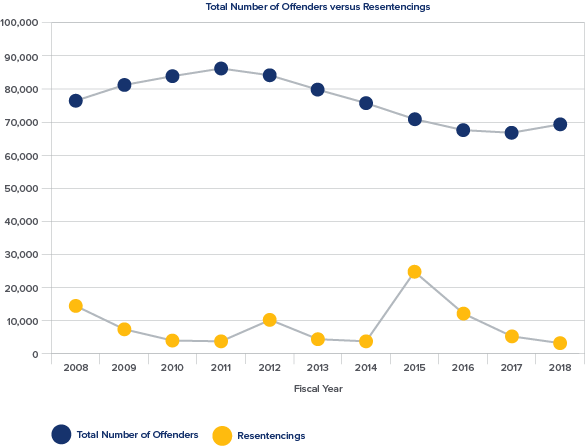
What produced the increase in offenders sentenced during FY2018? One likely circumstance is the recent significant increase in prosecutorial resources. After years of hiring freezes, DOJ has added more than 300 prosecutors since January 2017 – an increase of more than 5% of the estimated 5,500 lawyers in U.S. Attorney’s Offices. Another is the significant decrease in the number of proceedings in which an offender was resentenced based on a change in the law or other procedural issue. The 3,241 resentencing proceedings in FY2018 were a record low since the Commission began analyzing these proceedings in FY2008. The FY2018 numbers also marked a precipitous drop from recent years when statutory changes or court decisions resulted in higher numbers of resentencing proceedings. FY2018’s resentencing numbers were 38% lower than those in FY2017, 73% lower than FY2016, and 87% lower than the all-time high of 24,743 in FY2015. Prosecutors have more time to devote to new cases when they aren’t revisiting old ones. Similarly, prosecutors have more time for new cases when almost everyone is pleading guilty (like happened in FY2018) and there are fewer cases to prepare for trial.