

 />i
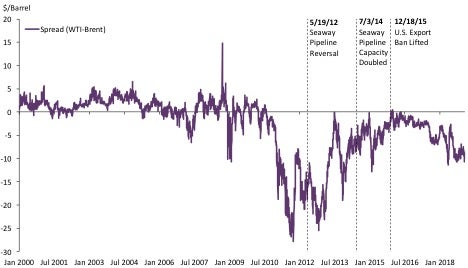
/>iBrent Crude Oil (Brent) and West Texas Intermediate (WTI) are the two leading global benchmark references for crude oil prices. Historically, the two have often tracked very closely to each other, without significant price variations. The exceptions were the period between 2011 and 2015, when prices for the two diverged dramatically, and, to a lesser extent, the period since mid-2017.
Figure 1: Spread between WTI and Brent Futures Prices
1/1/2000-2/28/2019
Source: Bloomberg
Note: The spread is calculated as the price of the WTI futures contract closest to expiry minus the Brent futures contract closest to expiry.
These prices are represented on Bloomberg as CL1 and CO1 respectively. CL1 trades on NYMEX and CO1 trades on ICE.
One reason for the first price divergence was the growth of U.S. crude production of WTI. Without the necessary infrastructure or regulatory certainty to facilitate crude exports from the U.S. and provide an outlet for this additional supply, WTI prices decreased relative to Brent, and trading volume in Brent futures contracts overtook WTI futures. Between 2015 and mid-2017, however, both infrastructure and regulatory changes in the U.S. led to price parity becoming the norm again.
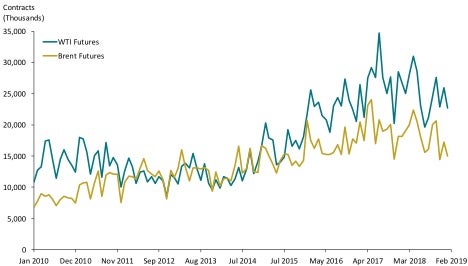
In mid-2017, prices began to diverge a second time as increases in crude prices led to a renewal of production growth and also contributed to a destocking of U.S. crude inventory. These and other market factors have caused the battle for benchmark supremacy to heat up again. In this latest round, WTI futures volumes are overtaking Brent futures.
This article examines the evolution and relationship between these two benchmarks and what factors have impacted their prominence as a benchmark.
About the Benchmarks
While crude oil is not a homogeneous commodity, over time market conventions have gravitated towards the use of standardized benchmark reference rates. Each unique grade of crude is typically priced at a discount or premium relative to benchmark rates to reflect its quality, characteristics, and location. Benchmark grades tend to have certain characteristics, including large production volumes, stable market environments, and consistent quality characteristics.
Both Brent and WTI are considered higher-quality crudes relative to crude oil produced in the Middle East and Russia, and require less refining to produce useable petroleum products.[i] Both are often referred to as “light and sweet” because of their high quality.[ii]
Their futures trading volumes have grown substantially over time, averaging more than eight times the volume in 2018 than in 2000. This increase is often explained by price volatility, the use of commodities as inflation protection, and an expansion of tradable products to better meet the needs of market participants.[iii]
Figure 2: Monthly Volume Comparison of ICE Brent and CME WTI Futures
1/1/2010-2/28/2019
Source: Bloomberg
Note: The aggregate future volume is the sum of the volumes of all maturities of ICE Brent and CME WTI futures. All futures volumes are aggregated on a monthly basis.
These benchmarks, however, are distinct in many ways. Brent, a European crude benchmark, is based on production from multiple oilfields in the North Sea. WTI is a U.S. crude benchmark that reflects the land-based crude oil stored in Cushing, Oklahoma.
In addition, while both Brent and WTI have developed futures markets with high volumes and many participants, Brent trades mainly on the Intercontinental Exchange (ICE) and WTI trades mainly on the CME Group (CME).
Surge of U.S. Crude Gives Brent the Edge
Between 2010 and 2018, extraction from shale reserves almost doubled the overall production of crude oil in the U.S. This growth was driven by new technological advancements that enabled horizontal drilling and fracking, coupled with historically high crude prices that led to massive infrastructure investments. Most of the new production came from PADD 3, comprising states in the Gulf Coast (see Appendices A and B). Expanded production resulted in increased supply and inventory of domestic oil in Cushing, Oklahoma, the main storage and pipeline hub for U.S. crude.
Figure 3: Total Quarterly Production of Crude Oil in North Sea and United States[iv]
Q1 2010-Q4 2018

Source: Dow Jones; Reuters News; U.S. Energy Information Administration
Note: The Seaway pipeline began pumping oil from Cushing, Oklahoma, to Houston, Texas, from May 19, 2012, to reverse the direction of the oil flow. The reversed service line had an initial capacity of 150,000 bpd and increased to 400,000 bpd in January 2013 and 850,000 bpd in July 2014.
Until 2010, WTI generally traded at a small premium over Brent, due in part to its lighter and sweeter characteristics. Given the increasing supply of U.S. crude, however, WTI prices declined relative to Brent, reaching a discount of more than $27 in October 2011.
WTI Catches Up
Two significant events helped to reverse the price disparity between WTI and Brent. The first was an investment in infrastructure to bring the oil to market.
Cushing, Oklahoma, is landlocked and inaccessible by tanker or barge, and pipelines are key to moving crude. When U.S. crude oil production increased rapidly, the existing pipeline was positioned to pipe crude into, but not out of, Cushing. In May 2012, Seaway Crude Pipeline Company LLC reversed the flow of the Seaway pipeline in order to pipe crude from Cushing to the Gulf Coast. When it reached full capacity in January 2013, the Seaway pipeline began moving about 400,000 bpd of crude oil to Texas. A twin (loop) of the pipeline, designed to run parallel to the existing line, was built and doubled the transportation capacity of crude oil to 850,000 bpd starting in July 2014.[v] An additional 100,000 bpd expansion is scheduled to come online in the first half of 2019.[vi]
The second event was a change in trade policy by the federal government. Traditionally, the U.S. government has tightly controlled oil exports. In fact, for 40 years, it had enforced a ban on exporting crude oil, allowing only minor exceptions such as oil shipped through the Trans-Alaska Pipeline, heavy oil from certain fields in California, and some small trades with Mexico.[vii]
At the end of 2015, the government lifted the ban on exporting crude oil from the continental U.S. Crude oil no longer had to be refined or lightly refined before exporting.[viii] Since the repeal of the ban, crude oil exports have risen, prompted by the increase in oil prices and by OPEC’s drive to cut production.[ix]
Figure 4: Weekly Levels of U.S. Crude Oil
1/1/2010-2/28/2019
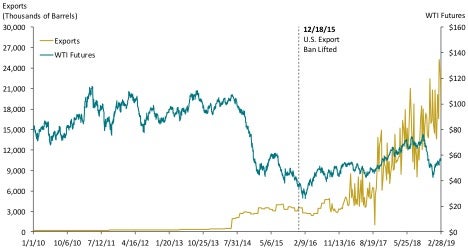
Source: U.S. Energy Information Administration; Bloomberg
Note:
1. In the past, the U.S. Commerce Department had given export licenses for particular types of oil. Crude from Alaska’s Cook Inlet, oil passing through the Trans-Alaska Pipeline, oil shipped north for Canadian consumption, heavy oil from particular fields in California, some small trades with Mexico, and some exceptions for re-exporting foreign oil made up those exports.
2. The WTI futures is the price of the futures contract on WTI traded on CME closest to expiry (front month) on any given day. The Bloomberg ticker for this is CL1.
Another factor that expanded trading options for physical oil traders was the widening of the Panama Canal in mid-2016. The locks in the canal were widened to 180 feet from 109 feet and became accessible to new, larger ships called New Panamax that can carry more than twice as much cargo as previous ships crossing the canal (see Appendix C).[x] The waterway shrinks distances between refineries situated along the Gulf of Mexico and Asia to 9,000 miles from 16,000 miles, allowing U.S. producers to better compete in one of the world’s biggest oil-consuming markets.
On a global scale, the U.S. produces about 10 percent of the world’s crude oil, and exports less than 15 percent of its total production, making up less than 2 percent of global volumes.[xi] As of late January 2019, U.S. output had surpassed daily production in Russia and Saudi Arabia, making the U.S. the world’s leading oil producer. Although the U.S. export volumes may be small, they are important because they represent additional market options for the increasing production in the U.S., and U.S. production is able to quickly respond to global market factors and supply the marginal crude oil necessary to fill temporary fluctuations in demand.[xii]
With WTI’s improved access to the Gulf Coast and with the export ban lifted, U.S. crude producers and exporters have more options regarding where and to whom to sell the crude.
New Supply Resumes Downward Price Pressure
Since mid-2017, the U.S. crude oil industry has witnessed a renewal in production growth. Production in Q4 2018 was 30 percent higher than Q2 2017 (see Figure 3). This growth was largely driven by an increase in crude oil prices from a range of $25-$55 a barrel between 2016 and H1 2017, to $60-$75 a barrel between the beginning of 2018 and the end of Q3 2018.
Additionally, as prices rose, crude oil kept in storage during the period of lower prices was destocked. In other words, it was no longer profitable to store oil because current prices exceeded the cost of storage and anticipated future prices. For a time, the futures forward curve shifted from contango to backwardation.[xiii]
Figure 5: Storage Capacity Utilization of U.S. Crude Oil
3/2011-9/2018
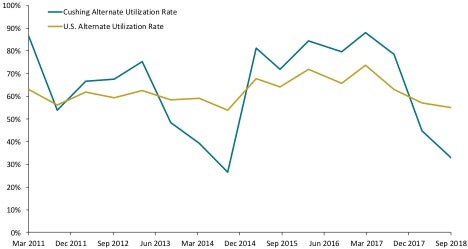
Source: U.S. Energy Information Administration
Note: Alternate Utilization Rate measures crude oil stores in tanks as well as crude oil in pipelines and in transit by rail in proportion to the sum of the tanks’ working storage capacity and stocks in transit.
These factors contributed to WTI prices decreasing relative to Brent prices and, as of early 2019, WTI was trading at close to a $10 discount to Brent. Interestingly, unlike the prior divergence in prices, growth in the trading of the WTI futures contract has outpaced that of Brent futures contracts (see Figure 2).
Figure 6: WTI and Brent Futures Prices
1/1/2003-2/28/2019

Source: Bloomberg
Note:
1. The WTI futures contract is the price of the futures contract on WTI traded on NYMEX closest to expiry (front month) on any given day.
The Brent futures contract is the price of the (front month) futures contract on Brent traded on ICE closest to expiry on any given day.
The Bloomberg tickers for these are CL1 and CO1 respectively.
2. The Seaway pipeline began pumping oil from Cushing, Oklahoma, to Houston, Texas, on May 19, 2012, to reverse the direction of the oil flow. The reversed service line had an initial capacity of 150,000 bpd and increased to 400,000 bpd in January 2013 and 850,000 bpd in July 2014.
Brent Crude Loses Steam
At the same time that U.S. crude production was booming, and trade policy was becoming less restrictive, production at the original oil fields that comprise Brent was steadily declining, including at the eponymous Brent oilfield (see Figure 3).
As production decreased, the composition of the benchmark changed with the gradual addition of new oil fields. These oilfields include Forties and Oseberg (added in 2002) and Ekofisk (added in 2007). Brent’s production base is thus referred to by the acronym of the four crude oil streams: BFOE. A fifth stream, Troll, was added in 2018, referred to as BFOE-T.[xiv]
The addition of Troll was an attempt to maintain a robust production base to support the Brent benchmark. In late 2018, S&P Global Platts (Platts) initiated an industry consultation on whether to make two additional changes to the benchmark. The first is to add Rotterdam cost-and-freight price (CIF) for the North Sea grades, which would likely double the volume of crude underlining the benchmark. The second is to include Russian, Central Asian, West African, or U.S. shale field crude in the Brent benchmark.[xv]
As each new field is added, the quality of oil and the ownership structure of what is considered Brent crude oil changes slightly (see Appendix D). The original Brent field oil has an API gravity of 37.5 degrees and a sulfur content of 0.4 percent, making it light and sweet.[xvi] However, the addition of the Forties field, which cannot be considered sweet as it exhibits sulfur content as high as 0.82 percent, has changed the oil quality of the benchmark.[xvii] Additionally, the Troll oil field has an API gravity of 35.9 degrees, too low to be considered light.[xviii]
Figure 7: Quality, Ownership, and Monthly Flow of Oil Fields Related to Brent Crude
|
Field |
Quality |
Ownership Partners |
Monthly Flow |
Year Added |
|
Brent |
Light, Sweet |
Shell 50.00% |
2,400 |
1975 |
|
Forties/Buzzard |
Light, |
Forties: |
11,400 |
2002 |
|
Oseberg |
Light, Sweet |
Equinor 49.30% |
3,600 |
2002 |
|
Ekofisk |
Light, Sweet |
Total 39.90% |
6,600 |
2007 |
|
Troll |
Not Light, Sweet |
Petoro 56.00% |
5,400 |
2018 |
Source: Thomson Reuters Monthly Production Data; https://www.cmegroup.com/rulebook/NYMEX/; https://www.platts.com/IM.Platts.Content/MethodologyReferences/MethodologySpecs/Crude-oil-methodology.pdf; http://factpages.npd.no/factpages/; http://www.offshore-technology.com/projects/brentfieldnorthseaun/; https://www.offshore-technology.com/projects/forties-oil-field-north-sea/; http://www.nexencnoocltd.com/en/Operations/Conventional/UKNorthSea/Buzzard.aspx; http://www.offshore-technology.com/projects/forties-oilfield-a-timeline/; https://www.ineos.com/businesses/ineos-fps/business/forties-blend-quality/; http://www.reuters.com/article/us-oil-platts-idUSKBN13R1PH; https://www.offshore-technology.com/projects/buzzard/; https://www.norskpetroleum.no/en/facts/field/oseberg/; http://www.conocophillips.no/our-norway-operations/greater-ekofisk-area/; https://www.offshore-technology.com/projects/troll-phase-three-development-north-sea/
Note:
1. Crude oil is considered “light” if it has an API gravity of between 37 and 42 degrees. Crude oil is considered “sweet” if it is low in sulfur content (
2. Ownership percentages rounded to two decimal places.
3. The Forties Blend, transported via the INEOS-operated Forties Pipeline System, is made up of crude oil from over 70 fields. Buzzard is broken out separately since it is the largest component field and its inclusion starting in 2007 “altered the hydrocarbon characteristics of the Blend.” See https://www.ineos.com/businesses/ineos-fps/business/forties-blend-quality/.
One function of a benchmark is to provide an easy reference for buyers and sellers to price the wide variety of crudes with an agreed-upon differential to the benchmark. The differential, however, is dependent on the quality of the benchmark both in terms of volume and consistent quality. The potentially changing nature of Brent crude oil quality could jeopardize its role as the leading benchmark in many pricing contracts.
BFOE-T constitutes around 1 percent of world crude production,[xix] and there is concern that it does not provide a solid enough base for the Brent spot market to perform efficiently. Market and trading participants have recognized this change, and trading of the main futures contract of WTI and Brent has reversed. WTI futures trading volume has risen rapidly on NYMEX and has surpassed Brent on ICE. In January 2019, 30.0 billion WTI futures contracts were traded on NYMEX, compared to 17.3 billion Brent futures contracts on ICE.
Brent’s Delivery Mechanism
The price and the cash settlement mechanism of Brent futures are tied directly to the BFOE forward market, whose prices are assessed and published by price reporting agencies (e.g., Platts). This forward market consists of contracts that can be traded up to three months ahead of delivery. The forward contract assessment reflects the outright price of a cargo with physical delivery during the specified contract month for Brent, Forties, Oseberg, Ekofisk, and Troll crudes.
The closest-to-delivery contract for crude from BFOE-T basins is the spot market known as Dated Brent. Unlike other spot markets, Dated Brent has an inherent “forward” component to the contracts. On any given day, the contracts are written for the assessment of crude 10 days to one month forward from the contract date.
To enhance hedging opportunities, Brent traders can use the contract-for-difference (CFD) market. CFDs are swap contracts that track the difference between Dated Brent and BFOE forwards and allow traders to cope with the basis risk between the physical market and the financial risk-management market.
On the appointed day of delivery, sellers in the market will always load the product that is cheapest to deliver within allowable specifications.[xx] The cheapest-to-deliver concept became more important in 2007 with the introduction of the Buzzard field into the Forties stream. Because Buzzard tends to have lower-quality crude than other basins, it often became the cheapest crude that would fulfill contractual obligations.
Several iterations of quality price de-escalators and premiums were introduced over the years to compensate buyers in the event of low-quality deliveries, or to incentivize sellers to deliver higher-quality crude. Currently, Platts publishes a de-escalator for Forties Blend monthly, and Quality Premiums for Oseberg and Ekofisk are published for the current and following month. As the supply of BFOE-T basins declines overtime, more crude streams may be added to the deliverable basket. This will imply ever more complex and more frequent premium and discount calculations, depending not only on quality specifications, but also on freight differentials.
Price Report Agencies
Given that physical oil is traded by a few industry participants over the counter instead of on an exchange, the industry benefits from the increased transparency that price-reporting agencies provide by publishing assessed prices of the physical oil. Industry participants commonly trade physical and derivative products by reference to the prices reported by agencies such as Platts, Argus, and ICIS.
The main price-reporting agency for physical oil is Platts, which reports daily prices for over 200 global crude oil markets.[xxi] In order to calculate these daily prices, Platts compiles bids, offers, and transactions data submitted by physical oil market participants throughout each day as part of the Market-on-Close (MOC) process.[xxii] The last 30 minutes are considered the MOC window, which is an assessment period that determines an end-of-day value by using all available data from the day. Platts requires that participants declare their intention to post bids or offers in the MOC window before a cutoff point in the afternoon, which is 30 minutes before the close of the market.
A concern for regulators is whether the benchmark prices could be distorted by market participants, given that reporting transactions is optional. In March 2012, the International Organization of Securities Commissions (IOSCO), an umbrella body of market regulators, issued a report raising questions of whether further regulation was necessary.[xxiii] Similarly, from 2013 to 2015, the European Commission launched an investigation into the potential manipulation of oil price benchmarks.[xxiv] While this investigation did not lead to any convictions or fines, the European Union issued updated Benchmark Regulations in mid-2016.[xxv]
Conclusion
The Brent and WTI crude oil benchmarks have long battled for supremacy, and each faces different challenges. Scrutiny over Brent’s falling production in the North Sea has long been a concern, and WTI faces scrutiny for being in a landlocked location.
The views expressed in this article are solely those of the authors, who are responsible for the content, and do not necessarily represent the views of Cornerstone Research.
Endnotes
[i] “Crude Oils Have Different Quality Characteristics,” Today in Energy, U.S. Energy Information Administration, July 16, 2012, https://www.eia.gov/todayinenergy/detail.php?id=7110; WTI is both slightly lighter (American Petroleum Index (API) gravity of 39.6 vs. 38.3 degrees) and sweeter (0.24% vs. 0.37% of sulfur) than its Brent counterpart.
[ii] WTI is both slightly lighter (API gravity of 39.6 vs. 38.3 degrees) and sweeter (0.24% vs. 0.37% of sulfur) than its Brent counterpart.
[iii] “What’s Driving Global Oil Volumes Right Now,” MarketVoice, March 10, 2017, https://marketvoice.fia.org/issues/2017-03/whats-driving-global-oil-volumes-right-now.
[iv] Total volumes for the North Sea fields Brent, Forties, Oseberg, and Ekofisk for July 2015, December 2015, and December 2016 were calculated by multiplying production rates by days of the month. Total volumes for June 2011, September 2011, October 2011, November 2011, October 2014, June 2015, July 2015, December 2015, December 2016, October 2017, and November 2017 for which data were unavailable were averaged from the latest prior and next earliest months’ total volumes.
[v] “About Seaway,” Seaway Crude Pipeline Company, http://seawaypipeline.com/.
[vi] “Seaway Begins Open Season,” Seaway Crude Pipeline Company Press Release, December 21, 2018, https://seawaypipeline.com/news/20181221PressRelease.pdf.
[vii] “Why the U.S. Bans Crude Oil Exports: A Brief History,” International Business Times, March 20, 2014, http://www.ibtimes.com/why-us-bans-crude-oil-exports-brief-history-1562689.
[viii] “Why the U.S. Bans Crude Oil Exports: A Brief History,” International Business Times, March 20, 2014, http://www.ibtimes.com/why-us-bans-crude-oil-exports-brief-history-1562689.
[ix] “OPEC, Allies Get Back on Track with Oil Cuts,” Bloomberg, May 17, 2019, https://www.bloomberg.com/graphics/opec-production-targets/.
[x] “Expanded Panama Canal Reduces Travel Time for Shipments of U.S. LNG to Asian Markets,” Today in Energy, U.S. Energy Information Administration, June 30, 2016, http://www.eia.gov/todayinenergy/detail.cfm?id=26892.
[xi] “U.S. Crude Production,” U.S. Energy Information Administration, https://www.eia.gov/dnav/pet/pet_crd_crpdn_adc_mbblpd_a.htm; “U.S. Exports by Destination,” U.S. Energy Information Administration, https://www.eia.gov/dnav/pet/pet_move_expc_a_EPC0_EEX_mbblpd_a.htm. For global oil production, see “BP Statistical Review of World Energy,” BP, June 2018, https://www.bp.com/content/dam/bp/business-sites/en/global/corporate/pdfs/energy-economics/statistical-review/bp-stats-review-2018-full-report.pdf.
[xii] “U.S. Oil Exports Double, Reshaping Vast Global Markets,” Wall Street Journal, June 7, 2017, https://www.wsj.com/articles/u-s-oil-exports-double-reshaping-vast-global-markets-1496833200.
[xiii] “CVR Refining Oil Storage Sale Comes as Cushing Inventories Near 4-Year Low,” S&P Global Market Intelligence, September 18, 2018, https://www.spglobal.com/marketintelligence/en/news-insights/trending/tbvgf2v8ca0kbf7d6en7cq2.
[xiv] “Another Type of Crude Oil to be Included in Calculation of the Brent Price Benchmark,” Today in Energy, U.S. Energy Information Administration, March 10, 2017, https://www.eia.gov/todayinenergy/detail.php?id=30292.
[xv] “Shell Says Russia Oil Must Be Considered for Brent Benchmark,” Bloomberg, May 10, 2017, https://www.bloomberg.com/news/articles/2017-05-10/shell-says-russia-s-oil-must-be-considered-for-global-benchmark; “Brent Benchmark Set for Revamp with Oil from Around the World,” Bloomberg, September 23, 2018, https://www.bloomberg.com/news/articles/2018-09-24/brent-benchmark-set-for-major-revamp-with-oil-from-around-world.
[xvi] “Riding the Wave: The Dated Brent Benchmark at 30 Years Old and Beyond,” Platts, February 2018, p. 5, https://www.platts.com/IM.Platts.Content/InsightAnalysis/IndustrySolutionPapers/sr-north-sea-riding-the-wave-dated-brent-feb-2018.pdf.
[xvii] “Forties Blend,” ExxonMobil, November 26, 2018, http://corporate.exxonmobil.com/en/company/worldwide-operations/crude-oils/forties-blend.
[xviii] “Crude Oil Assays,” Equinor, https://www.statoil.com/en/what-we-do/crude-oil-and-condensate-assays.html.
[xix] “Another Type of Crude Oil to Be Included in Calculation of the Brent Price Benchmark,” Today in Energy, U.S. Energy Information Administration, March 10, 2017, https://www.eia.gov/todayinenergy/detail.php?id=30292; Commodity Research Bureau, The CRB Commodity Yearbook (Barchart.com, 2018).
[xx] That is, the cargo whose quality specification is the lowest deliverable and thus would yield the lowest spot market price outside the futures delivery mechanism.
[xxi] “Platts Global Alert – Oil,” S&P Global Platts, https://www.spglobal.com/platts/en/products-services/oil/global-alert-oil.
[xxii] “An Introduction to Platts Market-On-Close Process in Petroleum,” Platts, https://www.platts.com/IM.Platts.Content/aboutplatts/mediacenter/PDF/intromocoil.pdf.
[xxiii] “Functioning and Oversight of Oil Price Reporting Agencies – Consultation Report,” OICU-IOSCO, Technical Committee of the International Organization of Securities Commissions, March 2012, https://www.iosco.org/library/pubdocs/pdf/IOSCOPD375.pdf.
[xxiv] “Oil Traders Spared as EU Commission Drops Price-Rigging Probe,” Bloomberg, December 7, 2015, https://www.bloomberg.com/news/articles/2015-12-07/oil-traders-spared-as-eu-commission-drops-price-rigging-probe.
[xxv] “Regulatory Engagement and Market Issues – European Benchmark Regulation,” S&P Global Platts, https://www.spglobal.com/platts/en/about-platts/regulatory-engagement.