


 />i
/>iIn litigation disputes involving the valuation of companies, such as in M&A or in bankruptcy, experts need to carefully consider the appropriateness of different valuation methodologies and the required inputs. In this article, we assess the impact of COVID-19 induced volatility on inputs commonly used in valuation, in particular financial forecasts and discount rates.
To put the impact of the current market situation on these inputs into context, we compare their current volatility to that during the financial crisis. We find that the behavior of these inputs is similar to that observed during the financial crisis, suggesting that these inputs may be hotly contested in litigation disputes.
Valuation methodologies
In M&A and bankruptcy litigation, experts commonly use two methodologies to value companies, discounted cash flow (DCF) analysis and relative valuation analysis.[1]
The DCF model “discounts” all the future cash flows of a firm to the valuation date in order to determine the value as of the valuation date. The model requires an estimate of expected future cash flows and additional inputs to determine an appropriate discount rate, such as an estimate of betas, which measures systematic risk.[2]
Relative valuation often involves an analysis of public comparable companies or an analysis of comparable precedent transactions. This analysis involves carefully selecting a set of comparable companies and calculating relevant financial ratios for these companies. These ratios are then applied to the company at issue.[3] These ratios can be forward- or backward-looking. If forward-looking ratios are used, then expected future financials are needed as inputs into the relative valuation model.
It is well established that there is often disagreement in litigation about these inputs—even before the COVID-19 pandemic—both in the M&A and the bankruptcy contexts.[4] This article looks at some of these valuation inputs and compares the changes during the COVID-19 period to changes during the financial crisis. In certain sectors, these changes are even more pronounced in the COVID-19 environment than they were during the financial crisis.
Increased uncertainty with regard to financial forecasts
Forecasting expected cash flows is a key part of DCF and relative valuation analyses involving forward-looking multiples. However, forecasting has been particularly difficult in the COVID-19 environment. Since the start of the COVID-19 pandemic, there has been a broad trend of public companies no longer providing financial guidance. Toward the end of June 2020, more than 40% of the companies in the S&P 500 index had withdrawn their financial guidance, citing the lack of financial visibility due to uncertainty regarding the duration and extent of the impact of COVID-19 on their business.[5]
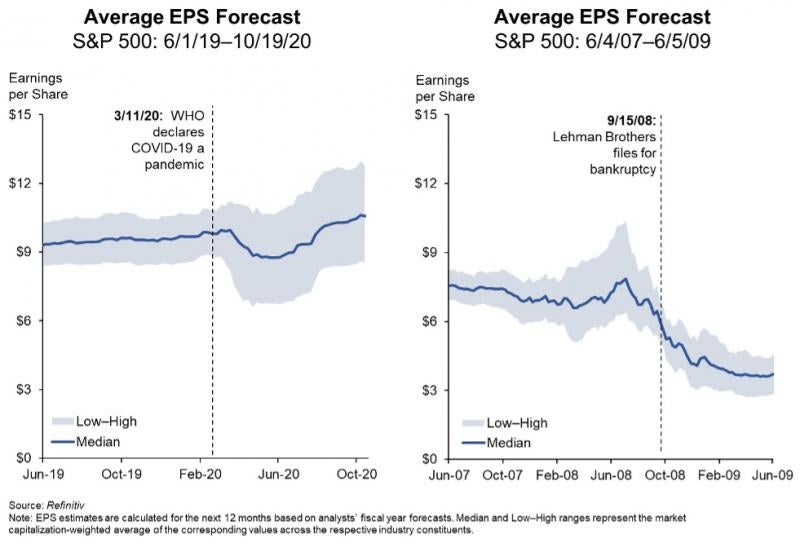
Not surprisingly, uncertainty and disagreement regarding financial projections on the part of sell-side analysts covering these companies have increased substantially. One common way to measure uncertainty or disagreement in financial projections is to look at the average range between the highest and lowest analyst-contributed earnings (or profit) estimates for companies in an industry. Based on this measure, disagreement in financial projections of earnings per share (EPS) forecasts has approached and sometimes surpassed levels of disagreement previously seen during the financial crisis.[6]
For example, dispersion of analyst EPS forecasts in the airline industry, which has been particularly affected by the COVID-pandemic, has increased 10 times compared to levels observed before the start of the pandemic.[7] As shown below, the airline industry is experiencing a higher dispersion of EPS forecasts now than the banking industry experienced during the height of the financial crisis, when financial institutions were especially hard-hit.
This phenomenon is not unique to the airline industry. Other industries experiencing similarly high dispersion of analyst EPS forecasts include oil, gas & consumable fuels, hotels, restaurants & leisure, and specialty retail.
As expected, there are industries for which analyst dispersion appears to have remained more stable during the current crisis, such as software, pharmaceuticals, and biotechnology.[8] Nonetheless, the number of industries that experienced a jump in this measure during the first half of the current year is greater than the analogous number recorded during the financial crisis.[9] Overall, as shown below, the data suggest that the market (as proxied by the S&P 500 index) has seen a substantial increase in the dispersion of analyst EPS forecasts since the start of the COVID-19 pandemic.
Therefore, when conducting business valuation in the COVID-19 environment, even more attention needs to be paid to carefully review and analyze the earnings forecasts being used. It is also likely that there will be more disagreement about these earnings forecasts in litigation going forward. Academic literature has shown that analyst disagreement is associated with an increase in the likelihood of encountering valuation disputes among creditors during the bankruptcy process.[10]
Increased volatility in betas
In addition to financial forecasts being affected by the COVID-19 pandemic, the discount rates used in a DCF analysis to discount future cash flows are affected as well. One input typically used to estimate the discount rate is a company’s beta. Beta is often estimated by comparing a stock’s historical returns to those of the market, and can be estimated using different estimation windows (e.g., the previous one, two, or five years of returns) and return frequencies (e.g., daily, weekly, or monthly).[11]
Estimating betas using weekly returns over the past two years shows that, on average, betas have increased substantially since the COVID-19 pandemic began in March 2020.[12] An increase in beta, all else equal, implies an increase in discount rate and a corresponding reduction in valuation. The increase in betas varies broadly across industries, with some—such as airlines, hotels, restaurants & leisure, REITS, or oil, gas & consumable fuels—being impacted more heavily.[13] With the exception of oil, gas & consumable fuels, all of these industries have experienced an even larger increase in betas during the COVID-19 pandemic than during the financial crisis.[14]
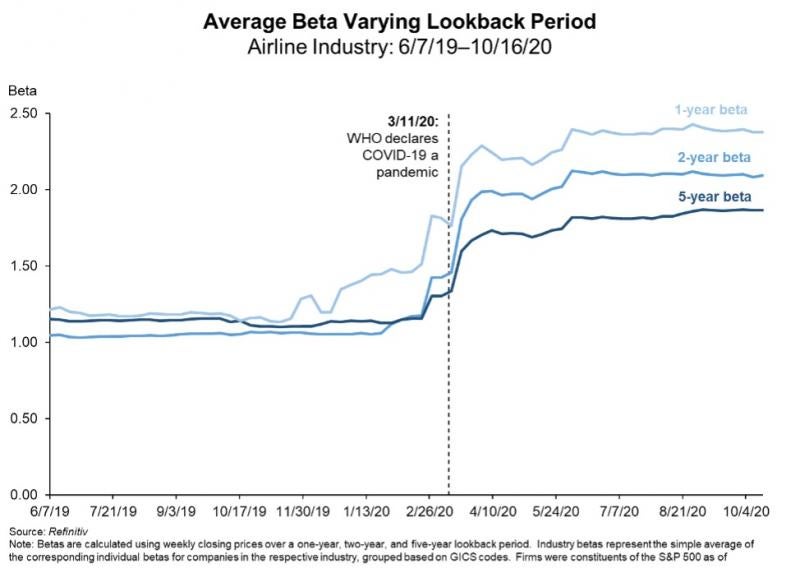
The COVID-19 pandemic has also resulted in an additional element of uncertainty regarding the most appropriate way to calculate beta. It is well established that the estimation period may impact betas.[15] Because the COVID-19 pandemic unfolded quickly, betas calculated using short-term lookback windows are more likely to be affected than betas calculated from longer-term data.
Taking the airline industry as an example, the chart below shows one-, two-, and five-year betas in the airline industry during the COVID-19 pandemic, all based on weekly returns. The average airline industry beta has doubled in the first half of 2020, using a two-year lookback period. Shortening that estimation period to one year results in an even larger increase, while the opposite can be observed for the longer five-year estimation period.
Finally, uncertainty associated with the current environment does not just affect the DCF methodology, but can also affect relative valuation. For example, careful consideration is required when applying precedent transaction analysis in the current environment. To the extent that multiples from precedent transactions reflect economic conditions unaffected by COVID-19, they may not be informative for valuation in the current context. Similarly, comparable company analysis may require additional examination to ensure that the set of comparable companies was exposed in a comparable manner to the COVID-19 environment.
Conclusion
Forward-looking cash flows and discount rates are key inputs into many valuation models. Heighted uncertainty around these inputs may lead to more valuation disputes related to valuation of the underlying companies. In this environment, it is more important than ever to carefully consider these valuation inputs and assumptions.
[1] Other methods, including real options valuation, LBO models, sum-of-the-parts valuation, or reliance on market factors, may also be important in some contexts. See Aswath Damodaran, Investment Valuation: Tools and Techniques for Determining the Value of Any Asset, Vol. 666 (John Wiley & Sons, 2012), Chapter 2. See also Appraisal Litigation in Delaware: Trends in Petitions and Opinions, 2006–2018, Cornerstone Research (2019), https://www.cornerstone.com/publications/reports/appraisal-litigation-delaware-2006-2018.pdf.
[2] A commonly used model to determine the cost of equity is the Capital Asset Pricing Model (CAPM). In the CAPM model, a company’s cost of equity is a function of the risk-free rate, the market risk premium, and the company’s beta. Beta is often estimated empirically from historical company and market returns. See Damodaran (2012), supra note 1, Chapters 4 and 8.
[3] The ratios can be based on valuation measures, such as market capitalization or enterprise value; financial performance measures, such as earnings per share (EPS), earnings before interest, taxes, depreciation, and amortization (EBITDA); revenue; or other measures. The ratios can also be based on forward-looking or historical performance measures, depending on the context of the valuation analysis. See Id., Chapter 2.
[4]Appraisal Litigation in Delaware: Trends in Petitions and Opinions, 2006–2018, Cornerstone Research (2019), https://www.cornerstone.com/publications/reports/appraisal-litigation-delaware-2006-2018.pdf; Kenneth Ayotte & Edward R. Morrison, Valuation Disputes in Corporate Bankruptcy, 166 U. Pa. L. Rev. 1819, 1819 (2018).
[5] Allison Prang, Coronavirus Erases Guidance from 40% of S&P 500, Wall St. J., June 28, 2020, https://www.wsj.com/articles/coronavirus-erases-guidance-from-40-of-s-p-500-11593363659; FactSet data, exclusively based on Q2 earnings reports of companies in the S&P 500 index, show that 53% of the companies that commented on EPS guidance for the current year were not providing EPS guidance. See FactSet, Are More S&P 500 Companies Now Providing EPS Guidance For 2020?, July 27, 2020, https://insight.factset.com/are-more-sp-500-companies-now-providing-eps-guidance-for-2020.
[6] Karen Langley & Caitlin Ostroff, Stocks Keep Rallying, Despite Lack of Visibility on Economy, Wall St. J., May 3, 2020, https://www.wsj.com/articles/stocks-keep-rallying-despite-lack-of-visibility-on-economy-11588498201; Tom Zanki, 3 Ways The Pandemic Has Changed How IPOs Are Done, Law360, May 22, 2020,
[7] Refinitiv. Based on market capitalization weighted average of EPS ranges of S&P 500 companies classified as part of a given industry (e.g. Airlines) according to GICS. For comparison purposes, weighted average EPS ranges of each industry are standardized by using as divisor the weighted average of the median EPS of the corresponding industry.
[8] Refinitiv.
[9] Id.
[10] Stuart C. Gilson, Edith S. Hotchkiss & Richard S. Ruback, Valuation of Bankrupt Firms, 13 Rev. Fin. Stud. 43 (2000).
[11] Damodaran (2012), supra note 1, Chapter 8.
[12] Karen Langley, For Some Stocks, Bad News Is Now Good News, Wall St. J., July 20, 2020, https://www.wsj.com/articles/for-some-stocks-bad-news-is-now-good-news-11595237401.
[13]Refinitiv. Based on the cumulative increase in average two-year betas by industry, from January 2020 until the peak reached at any point in time before the end of October 2020. The peak increases in average beta for these four industries are 1.08 (Airlines), 0.78 (Hotel, Restaurants & Leisure), 0.78 (REITS), and 0.51 (Oil, Gas & Consumable Fuels).
[14] Refinitiv. Comparing the maximum cumulative increase in average betas for each industry between January and October 2020, against the maximum cumulative increase in average betas for the same industries between July 2007 and June 2009.
[15] Thomas Gilbert et al, Daily Data Is Bad for Beta: Opacity and Frequency-Dependent Betas, 4 Rev. Asset Pricing Stud. 78 (2014).