


 />i
/>iExecutive Summary
To read the full report, please click here: Trends in Large Corporate Bankruptcy and Financial Distress
The COVID-19 pandemic triggered a spike in large corporate bankruptcy filings not seen since the global financial crisis. The number of large corporate bankruptcies in 2020 was second only to 2009’s peak, and bankruptcy filings by companies with more than $1 billion in assets were the highest since 2005.
As the economic recovery began to take hold, however, bankruptcies returned to lower levels in the first half of 2021. This pattern was consistent across most industries.
This report examines trends in Chapter 7 and Chapter 11 bankruptcy filings between January 2005 and June 2021. Unless specified otherwise, the bankruptcies analyzed in this report involve public and private companies with over $100 million in assets.[1]
-
A total of 155 companies filed for bankruptcy in 2020. This is the second-highest annual number of bankruptcy filings since 2005, only behind the 161 bankruptcy filings in 2009. (page 2)
-
Of the 155 bankruptcy filings in 2020, 104 occurred in Q2 and Q3 2020. In contrast, there were only 17 such bankruptcies in Q4 2020. (page 3)
-
In 1H 2021, 43 companies filed for bankruptcy, less than half of the number of bankruptcies (89) filed in 1H 2020, but slightly above the 2005–2020 annual average of 79 bankruptcy filings (i.e., 39 per half year). (page 3)
-
Bankruptcy filings by private companies constituted 79% of all bankruptcies in 1H 2021, substantially higher than the annual average of 37% for 2005–2020.
-
There were 60 “mega bankruptcies” (i.e., those filed by companies with over $1 billion in reported assets) in 2020. More than half (31) of the mega bankruptcies in 2020 were filed in Q2 2020. (page 2)
-
Only nine Chapter 11 mega bankruptcies were filed in 1H 2021. This is considerably lower than the 2020 level, although comparable to the 2005–2020 half-year average of 11. Of the mega bankruptcies in 1H 2021, four were filed by companies in the real estate industry. (page 3)
-
The largest bankruptcies in 2020 and 1H 2021 were filed by The Hertz Corporation with $25.84 billion in assets at the time of filing, and Seadrill Limited with $7.29 billion in assets at the time of filing, respectively. (page 6)
Bankruptcy Venues
-
Consistent with prior years, the most common venue for bankruptcy filings was Delaware, with 57 of the 155 bankruptcy filings (37%) in 2020, and 17 of the 43 bankruptcy filings (40%) in 1H 2021.
-
The second-largest venue was the Southern District of Texas, which in 2020, for the first time, accounted for more than 25% of bankruptcies filed. This trend continued in 1H 2021 with 28% of bankruptcies filed in the Southern District of Texas.
-
Of the 47 bankruptcies filed in the Southern District of Texas in 2020, 32 (68%) were by companies in the Mining, Oil, and Gas industry. Only three Mining, Oil, and Gas companies filed for bankruptcy in the Southern District of Texas in 1H 2021.
-
In 1H 2021, four of the 12 bankruptcies in the Southern District of Texas were filed by Electric Services companies.[2] Of those four, three were associated with the substantial increase in cost of wholesale power during Winter Storm Uri.
-
The Southern District of Texas employs a “two-judge system,” which has reportedly “created a sense of predictability” and is attractive to bankruptcy practitioners and their clients.[3] Non-energy companies that sought Chapter 11 relief in the Southern District of Texas since 2020 include retailers J.C. Penney, Neiman Marcus, and Tailored Brands as well as REITs CBL & Associates Properties and Washington Prime Group.
-
The third most common bankruptcy venue in 2020 was the Southern District of New York with 21 filings. In 1H 2021, the number of filings in this venue declined to three, representing only 7% of total bankruptcy filings.
-
These top three venues (Delaware, Southern District of Texas, and Southern District of New York) accounted for 81% of bankruptcies in 2020 and 74% in 1H 2021.
74%: Combined percentage of 1H 2021 bankruptcy filings in Delaware, Southern District of Texas, and Southern District of New York.
Figure 7: Heat Map of Bankruptcies by Venue
2005–1H 2021

Source: BankruptcyData
Note: Only Chapter 7 and Chapter 11 bankruptcy filings by companies (both public and private) with over $100 million in reported assets are included. For companies where exact asset values are not known, the lower bound of the estimated range is used. Asset values are not adjusted for inflation. “Other” includes courts with fewer than five bankruptcies in all years during the time period.
Market Indicators
-
Despite the decline in the number of bankruptcies in 1H 2021, some market commentators have expressed concerns about high corporate debt levels in the U.S.[4]
-
U.S. nonfinancial corporate debt outstanding stands at $11.2 trillion as of Q1 2021, 10.5% higher than at year end 2019. U.S. nonfinancial corporate debt has grown at an average annual rate of 4.4% since 2008.
-
The U.S. nonfinancial corporate debt to GDP ratio increased sharply from 46.5% in Q4 2019 to 57.1% in Q2 2020, substantially driven by a 9.5% decline in quarterly GDP in Q2 2020, but it has since recovered to 50.6% as of Q1 2021 due to the corresponding recovery in GDP.
-
Shortly after the onset of the COVID-19 pandemic in March 2020, both high-yield and investment-grade spreads relative to Treasury yields increased sharply and peaked on March 23, 2020, at levels that were 205% and 297% higher than their respective levels at the beginning of the year.[5]
-
Debt markets recovered after various monetary and fiscal policy responses by the U.S. government (e.g., near-zero federal funds rate, aggressive bond purchasing by the Federal Reserve, and stimulus packages including the CARES Act).[6]
-
Issuance of investment-grade and high-yield bonds, as well as equity, accelerated following the government response in early 2020. By the end of June 2020, issuance was 30% above historical levels.[7]
-
Near the end of June 2021, the investment-grade and high-yield spreads reached 0.86% and 3.03%, respectively, the lowest levels in the past five years.
-
Although borrowing costs are currently low by historical standards, a potential future increase in borrowing costs would generally raise companies’ interest expenses and may affect their ability to refinance existing debt. For companies that borrowed heavily to weather the COVID-19 pandemic, such a development could be particularly concerning, especially if borrowing costs rise before those companies have fully recovered from the pandemic.
50.6%: Ratio of nonfinancial corporate debt securities and loans outstanding to GDP in the U.S. as of March 2021.
Figure 8: Nonfinancial Corporate Debt Securities and Loans Outstanding
January 2008–March 2021

Source: FRED Economic Data
Note: GDP levels and nonfinancial corporate debt securities and loans outstanding are reported on a quarterly basis and are seasonally adjusted.
Figure 9: High-Yield and Investment-Grade Spreads
January 2020–June 2021
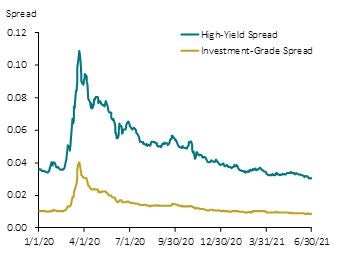
Source: FRED Economic Data
Note: ICE BofA US High Yield Index Option-Adjusted Spread is used as the high-yield spread, and ICE BofA US Corporate Index Option-Adjusted Spread is used as the investment-grade spread.
Endnotes
-
This report relies on data obtained from BankruptcyData on July 6, 2021. It focuses on asset values at the time of bankruptcy filings, due to the higher prevalence of missing information on liabilities in BankruptcyData.
-
“Electric Services” is an industry under the division “Transportation, Communications, Electric, Gas and Sanitary Service” according to Standard Industrial Classification.
-
“Bigger in Texas: Ch. 11s in Lone Star State Outpace Delaware,” Law360, May 7, 2021.
-
“Pandemic Hangover: $11 Trillion in Corporate Debt,” Wall Street Journal, June 14, 2021.
-
Spreads are relative to Treasury rates. The beginning of the year refers to January 2, 2020, the first trading day in 2020.
-
“Monetary Policy and Fiscal Policy Responses to the COVID-19 Crisis,” Federal Reserve Bank of St. Louis, November 10, 2020.
-
Edith Hotchkiss, Greg Nini, and David C. Smith, “Corporate Capital Raising during the COVID Crisis,” working paper, November 1, 2020. Historical levels are determined based on the average of values for 2011 to 2019.