


 />i
/>iHere’s a closer look at some information underlying the national statistics from the 2018 Sourcebook of Federal Sentencing Statistics. (Click here to go back to the main article.)
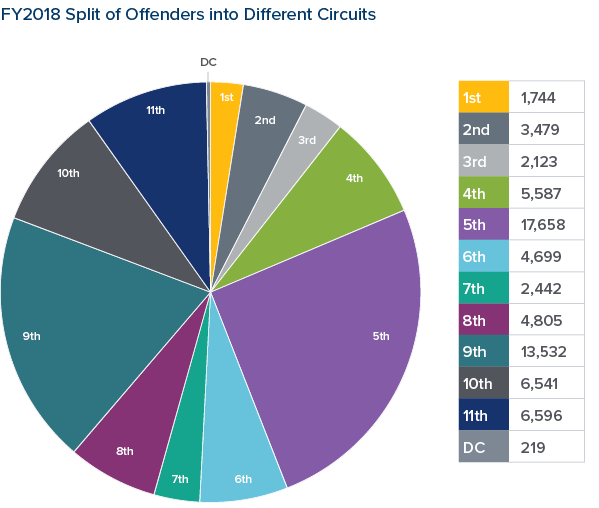
As noted in the main article, there were 69,425 federal offenders who were sentenced during FY2018. The districts in the Fifth Circuit – one of the twelve regional federal judicial circuits with criminal dockets – represented the largest share of offenders, with 25.4% of the total number of offenders. The Ninth Circuit (which includes districts from Alaska, Arizona, California, Guam, Hawaii, Idaho, Montana, Nevada, the Northern Mariana Islands, Oregon, and Washington state) had the next largest group of offenders, with 19.5% of the nationwide total.
The districts with the largest number of offenders in FY2018 were the Southwest border districts: the Western and Southern Districts of Texas, the District of Arizona, the District of New Mexico, and the Southern District of California. These districts carry a heavy immigration caseload. As we will detail in a future article, more than two-thirds of the offenders from those five districts combined were immigration offenders. The immigration offenders from these five districts represented more than 25% of the federal offenders in FY2018.
As noted in the main article, the 69,425 offenders sentenced during FY2018 is a 3.8% increase over the FY2017 total. Fifty-three of the ninety-four districts had more offenders sentenced in FY2018 than in FY2017; forty districts had fewer offenders, and one district had the same number as it did in FY2017.
-
Of the fifty-three districts with more offenders in FY2018, ten districts had increases of greater than 20%:
-
District of South Carolina: +36.2%
-
Southern District of California: +34.7%
-
Western District of Wisconsin: +34.5%
-
Northern District of Ohio: +31.1%
-
Western District of Oklahoma: +29.5%
-
Northern District of Indiana: +28.6%
-
Eastern District of Missouri: +26.4%
-
Western District of Texas: +22.3%
-
Southern District of Mississippi: +21.7%
-
District of Colorado: +20.4%
-
-
Two districts had increases of greater than 1000 offenders: the Western District of Texas (with 1475 more offenders than in FY2017) and the Southern District of California (with 1001 more offenders than in FY2017).
-
Of the forty districts with fewer offenders in FY2018, five districts had decreases of greater than 20%:
-
District of Minnesota: -28.6%
-
District of the Virgin Islands: -23.0%
-
Eastern District of Louisiana: -23.0%
-
District of Puerto Rico: -22.4%
-
District of New Jersey: -21.3%
-
-
The district with the largest decrease in the number of offenders was the District of Arizona, which had 798 fewer offenders (a decrease of 14.7% from FY2017).
-
There are different ways to analyze the FY2018 total offender numbers in the context of individual districts. One way is to look at the total offender numbers in each district. The FY2018 mean for individual districts was around 739 offenders. The closest district to the FY2018 mean (what might be called the “most national” district) was the Northern District of Illinois with 740 offenders.
-
In FY2018, the median number of offenders per district was around 418. The districts that represented the FY2018 median were the District of Oregon and the Southern District of Indiana. The median number of offenders per district in FY2018 was 2.7% higher than it was in FY2017, when the two districts representing the median were the Middle District of North Carolina and the Middle District of Pennsylvania. The median number of offenders in FY2018 was the highest since FY2014, when the median was around 434 offenders; the Central District of Illinois and the Northern District of Alabama represented the median districts that fiscal year.
-
As shown above, the difference between the FY2018 mean and median is sizable. One reason for that discrepancy is the caseloads from the five Southwest border districts, which have offender numbers far larger than nearly every other federal district. Because those offenders represent such a sizable proportion of the national caseload, they have a noticeable effect on the nationwide statistics and make it more difficult to see trends in other areas. So it can also be helpful when examining the national data to look at the numbers separate from those involving immigration offenders. The FY2018 mean for non-immigration offenders was around 484 offenders per district. By this measure, the “most national” district – the one closest to the mean – was the Northern District of California with 500 offenders.
-
The median number of non-immigration offenders per district in FY2018 was 370. The two median districts were the Eastern District of Kentucky and the District of Nevada. This non-immigration median was 3.5% higher than it was in FY2017, when the median districts were the Eastern District of Kentucky and the Middle District of Pennsylvania. The non-immigration median in FY2018 was the highest it has been since FY2014 (when it was 393 offenders). The median districts that year were the District of Utah and the Western District of Virginia.