


 />i
/>iWhile global demand for natural gas has decreased, consumption remains relatively resilient in the U.S., as power generation continues to move from coal to natural gas. U.S. natural gas production increased by 5 percent on average year-on-year from January through May 2020.
The International Energy Agency (IEA) forecasts a 4 percent drop in global natural gas demand as a result of global lockdowns to mitigate the spread of COVID-19 and low heating demand due to warm weather.
Lower Domestic Consumption Supported by Coal-to-Gas Switching
U.S. natural gas consumption decreased by 2.8 percent year-on-year for the period from January through May 2020.[i] This contrasts to Europe or Japan, which fell 7 percent and 5 percent, respectively, over the same period.[ii] The U.S. Energy Information Administration (EIA) forecasts a 3 percent and 5 percent contraction in 2020 and 2021.[iii]
The consumption drop was caused by a mild winter in Q1 2020 that affected the residential and commercial sectors, and by the COVID-19 pandemic and imposed lockdown measures in the industrial sector in Q2. The decline was mitigated by increased consumption in the power generation sector, with natural gas generation growing at the expense of coal.[iv] Coal-to-gas switching is often irreversible and may signal long-term structural changes that will impact the floor of the consumption of natural gas going forward.[v]
Continued Production Growth Leads to Inventory Build
U.S. natural gas production increased by 5.3 percent year-on-year on average from January to the end of May 2020 despite the lower domestic consumption.[vi]
This was offset by lower imports from Canada and an increase in Mexican and liquefied natural gas (LNG) exports, as well as a buildup in inventory levels.[vii] Inventory levels were 19 percent higher than their five-year average at the end of May and approaching the maximum level reached over the past decade.[viii]
The EIA projects production to contract in both 2020 and 2021.[ix] Protracted low prices could lead to less gas being produced as a secondary product from oil wells. In 2018, gas as a secondary product represented almost 15 percent of U.S. gas production.[x]
Prices Are Searching for New Lows
Henry Hub prices in Q1 2020 fell by over 33 percent year-on-year to an average of $1.9/mmBtu, the lowest quarterly price level since 1999, and reached $1.48/mmBtu in late June, the lowest inflation-adjusted price in over 30 years.[xi]
Both Asian and European prices dropped by roughly 60 percent over the first five months of the year. Asian LNG month-ahead contracts traded at an average of $2.03/mmBtu while Dutch TTF fell to $1.57/mmBtu in May. The tightening spread between U.S. and global benchmarks is closing opportunities for interregional arbitrage.
LNG Trade Volumes Remained High but Outlook Is Uncertain
While LNG trade volumes remained high in the first four months of 2020, with average daily U.S. LNG exports 54 percent higher than in 2019, they declined by 17 percent between April and May.[xii] The EIA still expects LNG exports to increase by 8 percent in 2020.
Europe accounts for two-thirds of global increases in LNG demand since the beginning of the year, amid subdued growth in Asia. Despite a 9 percent decrease in natural gas imports, European LNG imports increased by more than 20 percent year-on-year, replacing traditional pipeline imports from North Africa and Russia.[xiii]
U.S. LNG exporters are facing mounting challenges due to weakened demand and heavy competition from Qatar, Australia, and Russia.[xiv] The IEA projects a 4 percent drop in global natural gas demand in 2020, which would be “the largest recorded annual decrease in consumption since the natural gas market developed at scale in the second half of the 20th century.”[xv]
Meanwhile, global storage is building up across major markets, with European storage close to 80 percent full as of the end of June, and Japan and Korea LNG stocks 17 percent above their five-year average at the end of March.[xvi]
Over 100 U.S. LNG cargoes scheduled for loading in June onwards have been canceled to date, causing U.S. LNG exports to operate at less than half capacity.[xvii] The EIA estimates that as a result of these cancellations, average daily U.S. LNG exports for July and August will drop by 56 percent compared to the 2019 average before recovering in the fall as demand improves.[xviii]
Oil-indexed LNG contract prices, prevalent in Asian imports, did not experience as large a decrease during the first half of the year. The weighted average LNG import price for China, Japan, and Korea only decreased by just over 15 percent year-on-year in the first four months of 2020, to $8.8/mmBtu. However, prolonged low oil prices since March 2020 should impact oil-indexed LNG contract prices starting between July and September 2020, as the price-setting reference period is usually between three and six months ahead of delivery.[xix]
Figure 1: Evolution of Spot and Forward Gas Prices 2020
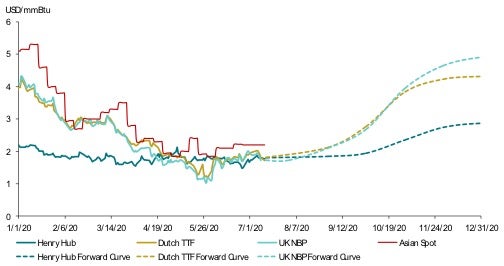
Source: Refinitiv
Note: The TTF front month price is converted from USD/MWH to USD/mmBtu using a conversion rate of 3.4121416331279 mmBtu per MWh. See https://www.aqua-calc.com/convert/energy/megawatt-hour-to-british-thermal-unit.
[i] “Commodity Tracker: 5 Charts to Watch This Week,” S&P Global Platts, July 6, 2020, https://blogs.platts.com/2020/07/06/lng-imports-demand-recovery-gas-storage/; 2020 IEA Report, p. 28.
[ii] 2020 EIA STEO Report, p. 15; “August Cargo Cancellations at US LNG Terminals Push Summer Total over 100,” S&P Global Platts, June 22, 2020, http://www.spglobal.com/platts/en/market-insights/latest-news/natural-gas/062220-august-cargo-cancellations-at-us-lng-terminals-push-summer-total-over-100.
[iii] 2020 EIA STEO Report, p. 15.
[iv] 2020 IEA Report, p. 26.
[v] 2020 EIA STEO Report.
[vi] 2020 IEA Report, p. 24.
[vii] “U.S. Natural Gas: Once Full of Promise, Now in Retreat,” Council on Foreign Relations, July 2, 2020, https://www.cfr.org/blog/us-natural-gas-once-full-promise-now-retreat.
[viii] 2020 IEA Report, p. 22.
[ix] 2020 IEA Report, p. 24.
[x] 2020 IEA Report, p. 28.
[xii] 2020 EIA STEO Report.
[xiii] “Annual Energy Outlook 2020,” EIA, January 29, 2020, https://www.eia.gov/outlooks/aeo/pdf/aeo2020.pdf (“2020 EIA AEO Report”), p. 54.
[xiv] 2020 EIA STEO Report.
[xv] “Gas 2020: Analysing the Impact of the COVID-19 Pandemic on Global Natural Gas Markets,” IEA, June 2020, https://www.iea.org/reports/gas-2020 (“2020 IEA Report”), p. 18.
[xvi] 2020 IEA Report, pp. 16, 20.
[xvii] “Short-Term Energy Outlook (STEO),” EIA, July 7, 2020, https://www.eia.gov/outlooks/steo/pdf/steo_full.pdf (“2020 EIA STEO Report”).
[xviii] 2020 IEA Report, p. 18.
[xiv] “More Than 100 Coal-Fired Plants Have Been Replaced or Converted to Natural Gas since 2011,” EIA, August 5, 2020, https://www.eia.gov/todayinenergy/detail.php?id=44636.
[xv] 2020 IEA Report, p. 24.