


 />i
/>iThis article looks at how the COVID-19 pandemic and other events created a price structure in futures and spot markets that incentivize market participants to store crude oil in the United States. It focuses on storage levels around Cushing, Oklahoma. The CME WTI Futures contract is based on a benchmark that reflects the price of crude oil in Cushing and is influenced by crude oil logistics in the area.[i]
Demand for crude oil in the United States has plummeted since the start of the COVID-19 pandemic, marked by a historic slowdown in consumption of refined products such as gasoline and jet fuel. Consumption fell by approximately 30 percent between March 13, 2020 (when President Trump declared a national emergency) and April 17, 2020.[ii]
Over the same period, U.S. production of crude oil—previously at record levels—fell by only 7 percent[iii] while net imports were overall unchanged.[iv] The United States and Canada have begun to dial back production, even shutting down productive wells. The number of active U.S. oil and gas drilling rigs declined from 792 to 529 between March 13 and April 17, 2020.[v]
Production is unable to adjust quickly to abrupt changes in consumption levels. It can take months for the flow from new wells to taper off, and producers are reluctant to shut down wells.[vi] For example, if producers believe the drop in demand and price is only temporary, they will avoid stopping production given the non-trivial costs and risk associated with shutting down and later restarting wells.[vii]
As a result of the dramatic fall in demand and the disparity between changes in consumption and changes in production, oil prices have decreased by nearly 70 percent since the beginning of the year.[viii] This decline was exacerbated by what the media is calling an “oil war” between Russia and Saudi Arabia in early March, which led Saudi Arabia to raise production and further increase the stocks of oil available globally.[ix]
Figure 1: WTI and Brent Futures Prices 1/1/20-4/17/20
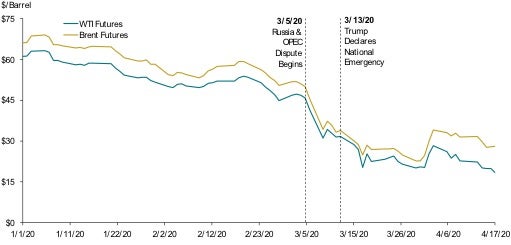
Source: Refinitiv
Note: The WTI futures contract is the price of the futures contract on West Texas Intermediate traded on NYMEX closest to expiry (front month) on any given day. The Brent futures contract is the price of the (front month) futures contract on Brent traded on ICE closest to expiry on any given day. The Refinitiv tickers for these are CLC1 and LCOC1, respectively.
Storage Utilization Rates Jump as Forward Curve Moves to a Super Contango
The price drop was much sharper for nearby contracts (contracts delivering soon) versus later contracts. This super contango[x} in the price structure has created a huge incentive for market participants to store barrels rather than sell them in the spot market for nearby delivery. The resulting physical stocks are so massive the IEA warned it could “overwhelm” storage capacity.[xi]
Figure 2: Spread between Five-Year and Nearby CME WTI Futures 1/1/14–4/17/20

Source: Refinitiv; U.S. Energy Information Administration
Note:
1. The WTI futures contract spread is the difference in the price of the five-year and closest to expiry (front month) futures contracts on West Texas Intermediate traded on NYMEX on any given day. The Refinitiv tickers for these are CLC60 and CLC1, respectively.
2. Alternate Utilization Rate measures crude oil stores in tanks as well as crude oil in pipelines and in transit by rail in proportion to the sum of the tanks’ working storage capacity and stocks in transit. Weekly utilization rates were calculated from weekly crude oil stocks compared to the most recent available semiannual storage and stocks in transit figures released by the EIA.
The last super contango, in late 2014, occurred as the increase in U.S. shale crude oil production contributed to a global supply glut.[xii] It is informative to look at how storage utilization evolved around that time. EIA data show that the storage utilization rate in Cushing, Oklahoma, jumped from 26 percent in September 2014 to 81 percent in March 2015 while nationwide utilization increased from 54 percent to 68 percent during the same six-month period. Cushing is home to the delivery location for CME’s WTI futures contract. It contains the largest oil-storage tank farm in the world and offers key transportation interconnections with pipeline networks that link the Midwestern producing regions to refineries in the area and on the Gulf Coast.[xiii]
Figure 3: U.S. Crude Oil Weekly Storage Capacity Utilization 4/1/11–4/17/20
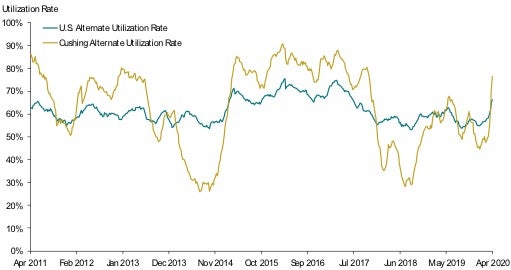
Source: U.S. Energy Information Administration
Note: Alternate Utilization Rate measures crude oil stores in tanks as well as crude oil in pipelines and in transit by rail in proportion to the sum of the tanks’ working storage capacity and stocks in transit. Weekly utilization rates were calculated from weekly crude oil stocks compared to the most recent available semiannual storage and stocks in transit figures released by the EIA.
Looking Ahead
Assuming the buildup will continue at the latest rate of roughly 15 million barrels per week,[xiv] the United States would hit 100 percent storage capacity sometime in August 2020, with some parts of the country reaching full capacity much earlier. In Cushing, assuming a buildup of 5 million barrels a week, 100 percent capacity would be reached by mid-May 2020. Operational constraints, however, suggest storage could become effectively full well before capacity reaches 100 percent; some must remain available for receiving new deliveries, tank-to-tank transfers, blending, and other routine operations.[xv]
There may be some extra storage cushion available to the market through offshore storage in floating tankers and if the U.S. government increases its strategic petroleum reserves. The IEA estimates that the global amount of oil being stored on vessels at sea rose 27 percent to 103.1 million barrels in March 2020, adding that there may be “a significant increase in floating storage in the coming few months as oil surpluses mount.”[xvi] Furthermore, the U.S. government’s strategic petroleum reserve, which held 635 million barrels as of March 27, 2020, has enough capacity to hold another 78.5 million barrels.[xvii] Finally, global production cuts may help ease some pressure on storage capacity. Saudi Arabia and Russia reportedly ended their dispute on April 12, 2020, as part of a production deal in which both countries and the United States will lead a coalition of 23 oil-producing countries to cut output by 9.7 million barrels a day.[xvii Further cuts may follow.
Note: On April 20, 2020, the nearby WTI futures price and some spot physical contracts fell into negative territory.
Looking Ahead
Assuming the buildup will continue at the latest rate of roughly 15 million barrels per week,[xviii] the United States would hit 100 percent storage capacity sometime in August 2020, with some parts of the country reaching full capacity much earlier. In Cushing, assuming a buildup of 5 million barrels a week, 100 percent capacity would be reached by mid-May 2020. Operational constraints, however, suggest storage could become effectively full well before capacity reaches 100 percent; some must remain available for receiving new deliveries, tank-to-tank transfers, blending, and other routine operations.[xix]
There may be some extra storage cushion available to the market through offshore storage in floating tankers and if the U.S. government increases its strategic petroleum reserves. The IEA estimates that the global amount of oil being stored on vessels at sea rose 27 percent to 103.1 million barrels in March 2020, adding that there may be “a significant increase in floating storage in the coming few months as oil surpluses mount.”[xx] Furthermore, the U.S. government’s strategic petroleum reserve, which held 635 million barrels as of March 27, 2020, has enough capacity to hold another 78.5 million barrels.[xxi] Finally, global production cuts may help ease some pressure on storage capacity. Saudi Arabia and Russia reportedly ended their dispute on April 12, 2020, as part of a production deal in which both countries and the United States will lead a coalition of 23 oil-producing countries to cut output by 9.7 million barrels a day.[xxii] Further cuts may follow.
Note: On April 20, 2020, the nearby WTI futures price and some spot physical contracts fell into negative territory.
The views expressed in this article are solely those of the authors, who are responsible for the content, and do not necessarily represent the views of Cornerstone Research.
To learn more about the WTI futures contract, see Greg Leonard, Nicole M. Moran, and Laurent Samuel, “Battle of the Benchmarks: Brent Crude Oil and West Texas Intermediate,” Cornerstone Research, 2019, https://www.cornerstone.com/Publications/Articles/Battle-of-the-Benchmarks-Brent-Crude-Oil-and-West-Texas-Intermediate.
[i] “U.S. Weekly Product Supplied,” U.S. Energy Information Administration, https://www.eia.gov/dnav/pet/pet_cons_wpsup_k_w.htm, accessed April 22, 2020.
[ii] “Weekly U.S. Field Production of Crude Oil,” U.S. Energy Information Administration, https://www.eia.gov/dnav/pet/hist/LeafHandler.ashx?n=PET&s=WCRFPUS2&f=W, accessed April 22, 2020.
[iii] EIA weekly data reports that both U.S. imports and exports fell over the same period such that net imports remained flat overall. US exports decreased by roughly 1.5 million barrels a day (34%), while imports decrease by roughly 1.6 million barrels a day (24%).
“Weekly U.S. Imports of Crude Oil,” U.S. Energy Information Administration,
https://www.eia.gov/dnav/pet/hist/LeafHandler.ashx?n=PET&s=WCRIMUS2&f=W, accessed May 8, 2020.
“Weekly U.S. Exports of Crude Oil,” U.S. Energy Information Administration,
https://www.eia.gov/dnav/pet/hist/LeafHandler.ashx?n=PET&s=WCREXUS2&f=W, accessed May 8, 2020.
[iv] “North America Rotary Rig Count (Jan 2000–Current),” Baker Hughes, https://bakerhughesrigcount.gcs-web.com/na-rig-count, accessed April 22, 2020.
[v] Ryan Dezember and Vipal Monga, “North America’s Oil Industry Is Shutting Off the Spigot,” Wall Street Journal, April 13, 2020, https://www.wsj.com/articles/north-americas-oil-industry-is-shutting-off-the-spigot-11586770200?mod=article_inline.
[vi] Ryan Dezember and Vipal Monga, “North America’s Oil Industry Is Shutting Off the Spigot,” Wall Street Journal, April 13, 2020, https://www.wsj.com/articles/north-americas-oil-industry-is-shutting-off-the-spigot-11586770200?mod=article_inline.
[vii] Based on nearby WTI futures prices from Refinitiv.
[viii] Clifford Krauss and Stanley Reed, “Oil Prices Dive as Saudi Arabia Takes Aim at Russian Production,” New York Times, March 8, 2020, https://www.nytimes.com/2020/03/08/business/saudi-arabia-oil-prices.html.
[ix] Contango is a situation where the deferred price, futures or forward price, of a commodity is higher than the spot price of the contract today.
[x] Grant Smith, “Oil Glut May Overwhelm Global Storage Tanks Within Weeks,” Bloomberg, April 15, 2020, https://www.bloomberg.com/news/articles/2020-04-15/oil-glut-may-overwhelm-storage-despite-opec-cut-iea-says.
[xi] Jacob Gronholt-Pedersen, “Crude Oil Seen Stored on Tankers in 2015 as Contango Widens,” Reuters, December 23, 2014, https://www.reuters.com/article/us-oil-storage-floating/crude-oil-seen-stored-on-tankers-in-2015-as-contango-widens-idUSKBN0K11P320141223.
[xii] See, e.g., Arthur Berman, “Cushing, Oklahoma is the Center of the Oil Universe,” Business Insider, March 1, 2016, https://www.businessinsider.com/cushing-oklahoma-is-the-center-of-the-oil-universe-2016-3.
[xiii] “Weekly Supply Estimates: Stocks – Crude Oil, Commercial (Excl. Lease Stock ),” U.S. Energy Information Administration, http://www.eia.gov/dnav/pet/pet_sum_sndw_a_epc0_sax_mbbl_w.htm, accessed April 22, 2020.
[xiv] Buildup week of April 17, 2020.
[xv] John Kemp, “Column: U.S. Crude Oil Storage Is Filling Rapidly,” Reuters, April 20, 2020, https://uk.reuters.com/article/uk-oil-prices-kemp/column-u-s-crude-oil-storage-is-filling-rapidly-idUKKBN222111.
[xvi] David Hodari and Ryan Dezember, “Oil Demand Projected to Fall by Record Amount,” Wall Street Journal, April 15, 2020, https://www.wsj.com/articles/oil-demand-projected-to-fall-by-record-amount-11586940434.
[xvii] Everett Wheeler, Allison Good, and Corey Paul, “No Place to Go: Oil Storage Filling up Amid Collapsing Demand, Excess Production,” S&P Global Market Intelligence, April 6, 2020, https://www.spglobal.com/marketintelligence/en/news-insights/latest-news-headlines/no-place-to-go-oil-storage-filling-up-amid-collapsing-demand-excess-production-57865154.
[xviii] “The 10th (Extraordinary) OPEC and Non-OPEC Ministerial Meeting Concludes,” Organization of the Petroleum Exporting Countries (OPEC), April 12, 2020, https://www.opec.org/opec_web/en/press_room/5891.htm.