


 />i
/>iMarketed production of natural gas reached a record high in 2019, continuing the steady growth observed since 2005. This growth, driven by U.S. shale expansion, outpaced consumption and net exports, leading to a storage buildup.
In January 2020, the EIA estimated annual growth of natural gas production through 2025 to hover around 2 percent. The repercussions of the COVID-19 pandemic, however, ushered in a contraction of consumption, rising storage capacity utilization, and a price collapse.
Domestic Market
- Annual marketed production of natural gas increased 10 percent in 2019, reaching 41,117 tBtu.
- Natural gas consumption rose in 2019 by 3 percent, increasing from 34,305 tBtu to 35,499 tBtu.
- The EIA, which until January projected annual natural gas production to grow by 2 percent through 2025,[i] now anticipates a 3 percent and 6 percent contraction in 2020 and 2021 as a result of the COVID‑19 pandemic and falling prices.[ii]
The EIA expects U.S. natural gas consumption to decline by 3 percent in 2020 and 5 percent in 2021 given the lower industrial sector economic activity caused by COVID-19 mitigation efforts.[iii]
Exports
- Global demand for natural gas cooled in 2019 following a milder winter and slower economic growth.[iv] As a result, U.S. net exports did not bridge the production to consumption gap, leading to a strong storage buildup (see Figures 2 and 3).
- LNG’s share of total U.S. natural gas exports rose to 39 percent in 2019 from 30 percent in 2018. The remaining 61 percent was exported via pipeline.[v]
- U.S. LNG exports to China decreased by over 90 percent, with Europe absorbing the majority of incremental supply.[vi]
The EIA, which until January projected U.S. net exports of natural gas to increase by 120 percent between 2019 and 2021, has revised this forecast to 43 percent. Projected LNG export growth over the same period was reduced from 77 percent to 46 percent.[vii]
Figure 2: U.S. Natural Gas Balance Sheet 2019
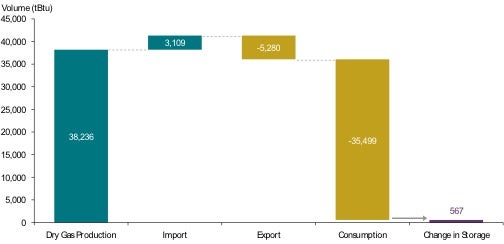
Source: U.S. Energy Information Administration
Note: Values are converted using the 2019 Marketed Production conversion rate of 1,134 Btu per cubic foot of natural gas. Dry Gas Production is Marketed Production (41,117 tBtu) less Natural Gas Plant Liquids (NGPL) Production (2,881 tBtu). The Dry Gas Production value also includes “Supplemental Gaseous Fuels.” Consumption value also includes the “Balancing Item” used by EIA to reconcile volume measurements.
Figure 3: U.S. Natural Gas in Underground Storage 2010–2019
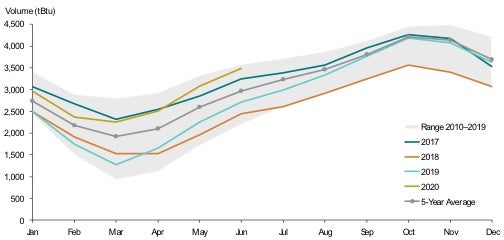
Source: U.S. Energy Information Administration (EIA)
Note: tBtu conversion uses the Marketed Heat Content Btu per cubic foot. Volumes are converted from billions of cubic feet to tBtu using the Marketed Heat Content reported by the EIA. Five-year averages and 2010–2019 ranges are based on daily linear interpolations of the working gas inventory values between each week reported, and are converted to tBtu using the 2019 Marketed Heat Content Btu per cubic foot.
Read the report, Characteristics of U.S. Natural Gas Transactions: FERC Form 552 Submissions as of July 2020.
Read 2020 Midyear Review on Natural Gas: A Look at COVID‑19’s Impact.
[i] 2020 EIA AEO Report , p. 46.
[ii] 2020 EIA STEO Report.
[iii] 2020 EIA STEO Report.
[iv] China’s economic growth rate fell to an estimated 6.1 percent according to the IMF, its lowest annual increase since 1990.
[v] Percentage for 2018: 1,083,118 mmcf total LNG exports / 3,607,418 mmcf total natural gas exports = 30 percent. Percentage for 2019: 1,819,386 mmcf total LNG exports / 4,656,312 mmcf total natural gas exports = 39 percent. See “ U.S. Natural Gas Exports and Re-Exports by Country,” EIA, accessed July 31, 2020, https://www.eia.gov/dnav/ng/NG_MOVE_EXPC_S1_A.htm (“EIA U.S. Natural Gas Exports Data”).
[vi] EIA U.S. Natural Gas Exports Data.
[vii] 2020 EIA STEO Report, Table 5a; 2020 EIA AEO Report, Table 13.