


 />i
/>iPlatform Competition and the Regulation of Stock Exchange Fees
-
Introduction
Stock exchanges are textbook examples of multi-sided platforms.1 Their core business is to provide a venue, infrastructure, and rules that enable buyers and sellers of stock to transact with each other. In that sense, a stock exchange is a platform that brings together buyers and sellers of stock. To be successful, stock exchanges must attract sufficient numbers of market makers, who provide liquidity by quoting prices and stand ready to buy or sell, as well as traders pursuing other strategies, who often take the liquidity market makers provide by “hitting” their offers to buy (bids) or sell (offers or asks). These two “sides” of the platform are linked by externalities as liquidity takers benefit if more liquidity providers are active on an exchange, and vice versa. Therefore, competitive constraints on stock exchanges cannot be understood without considering the alternatives available to both liquidity takers and liquidity providers and the linkages between these groups.
Stock exchanges are also multi-sided platforms in another sense: they are platforms for users of trading, data, and co-location services. Stock exchanges have undergone a technological transformation over the past several decades. Trading floors have largely been replaced by exchange servers, and the services that brokers and specialists (designated liquidity providers) provided are now largely carried out by algorithms.2 Order entry, message acknowledgment, matching algorithms, trade confirmations, and market data systems all operate at time scales measured in fractions of a second.3 Exchanges offer co-location services that enable market participants to place their servers in close physical proximity to exchanges’ matching engines.4 Stock exchanges also offer a variety of proprietary data products that provide insight into trading and order activity. These trading, data, and co-location services are used by overlapping sets of firms (some use all three, some only a subset) and the value of these services is interconnected. Data from a stock exchange, for example, are more valuable when the exchange carries more trading activity.
Stock exchanges offer these services in a highly regulated environment where the U.S. Securities and Exchange Commission (SEC) reviews and can “set aside” new product offerings and fee changes. In particular, the fees charged by stock exchanges for their trading, data, and co-location services must be “reasonable.”5 Reasonableness can be assessed through a “market-based test” that focuses on competitive constraints faced by stock exchanges when setting fees.6
Stock exchanges, as multi-sided platforms, face competitive constraints that can operate through various business lines. For instance, data fees should not be analyzed in isolation without accounting for the competitive dynamics in trading services. That is, competition is properly understood as being between platforms (i.e., stock exchanges) that balance the needs of consumers of trading services, consumers of data, and consumers of co-location services. Competition between platforms can be consistent with prices that deviate from marginal costs on one or more sides of the market and often does not lead to prices that reflect costs in the way that non-platform models of competition predict. But such platform competition can discipline stock exchanges’ overall pricing and profitability.
Evaluating the reasonableness of stock exchanges’ data fees has been an area for the practical application of platform economics at least as far back as 2006. However, despite years of regulatory submissions and review, as well as related litigation, a benchmark for analysis of platform competition accepted by the SEC has not been set.
In this article, we give an overview of these issues, beginning with a discussion of stock exchanges’ business models and the role of trading, data, and co-location services in Section II. We explain the linkages between trading, data, and co-location services that make stock exchanges platforms for these services in Section III. Section IV provides a summary of the history and current status of the use of platform economics to evaluate the reasonableness of stock exchange fees.
-
Overview of Stock Exchange Business Model
Stock exchanges facilitate the trading of securities by centralizing transactions and setting rules for how traders can offer to buy and sell stock and how they may reach an agreement to trade with each other. Companies that list their shares on a stock exchange signal that they meet the exchange’s SEC-approved listing standards, including market capitalization thresholds and rules for corporate governance.7
Trading activity generates copious amounts of data on transaction prices and orders, which stock exchanges sell. Some market participants want high-speed access to market data and order execution services. One way in which stock exchanges fulfill this demand is by renting “rack space” in close physical proximity to the exchange’s matching engine and offering on-premises data feed connections.
Trading of listed U.S. equities today takes place on 16 registered exchanges, alternative trading systems (“ATSs”), dark pools, and broker-dealer internalizers.8 The major exchanges, where most trading takes place, are owned by NYSE, NASDAQ, and Cboe.9 Four smaller exchanges, collectively accounting for about 6.5 percent of trading volume as of September 2021,10 are recent entrants with three having started operations in late 2020.11 During the same period, over 40% of U.S. equity trading volume was off-exchange on ATS, dark pools, and broker-dealer internalizers; as of February 2020, there were more than 50 dark pools registered with the SEC.12
Trading Services
Exchanges charge a fee for each executed transaction.13 Transaction fees vary according to a variety of factors, with the role of the trading firm being most prominent. The predominant transaction pricing structure on stock exchanges is a “maker-taker” fee model, where the exchange pays the firm that provided liquidity while charging the firm that took it.14
As of 2019, seven of 13 registered stock exchanges then in operation used a maker-taker transaction fee model.15 Other exchanges (four of 13) differentiated their offerings by using a “taker-maker” model where liquidity takers are compensated and liquidity providers pay transaction fees. A third group charges a flat fee to both liquidity providers and takers. These fee structures reflect stock exchanges’ efforts to attract both liquidity providers (in particular, market makers) and takers.16 Fees for accessing liquidity (i.e., those charged to liquidity takers) are capped at 0.3 cents per share, however, limiting stock exchanges’ options.17
Academics find that the current market structure and regulatory regime generate intense competition for order flow that has driven transaction fees down.18 For example, the average net transaction fee per share traded on NYSE was $0.000592 in 2016.19 Some scholars find even lower net transaction fees.20
Market Data
Market data are often divided into two categories: core (securities information processor (SIP) or consolidated feed) data and non-core (or proprietary) data.21 Consolidated feed data are assembled by the SIPs, which aggregate data from all exchanges to provide (1) last sale reports, including the price and amount of the latest sale of a security and the exchange where it took place; and (2) best bid and best offer (also known as top of book) price quote information across all exchanges.22 Among other uses, brokers access the consolidated feed in order to comply with Rule 603(c) of Regulation NMS, known as the Vendor Display Rule, which requires broker-dealers—when a trading or order-routing decision can be implemented—to provide a consolidated display of market data when they are providing equity quotation or trade information to customers.23
Proprietary data products are offered by individual exchanges and contain data about only that exchange, not about the market as a whole. Exchanges offer a variety of proprietary data products, some of which provide only top of book data while others provide varying levels of depth-of-book information.24 Different market participants may use proprietary data for a number of purposes, including (1) to inform trading decisions by enhancing their understanding of liquidity and likely price movements, (2) to inform order routing decisions about where to send an order or by enabling them to assess the likelihood of execution at various venues, and (3) to enable the operation of trading platforms (dark pools or ATS).
Stock exchanges make different choices regarding if and how much to charge customers for market data.25 It is common for new stock exchanges or exchanges focused on increasing their share of trading to offer their data free of charge. Established stock exchanges typically charge for their data, as the NASDAQ exchanges, the Cboe exchanges, and most NYSE Group Exchanges do.26 Stock exchanges may choose to transition from a no-fee model to one where they charge for their data as NYSE Arca did in 2009 and the BATS exchanges (BZX and BYX) did in 2013.27 Pricing strategies such as these are natural outcomes in platform markets, where building a base of users on all “sides” of the market is crucial for a platform’s viability.
Co-location
Co-location is a service that offers “rack space” to market participants that enables them to place their servers in close proximity to a stock exchange’s matching engine.28 Co-location can be thought of as a modern manifestation of the desire by some market participants to be close to the center of trading, which was historically offered through exchange membership allowing access to the trading pits.29
Some trading firms engage in trading strategies that are speed-sensitive. These include market-making (providing liquidity) and certain arbitrage strategies.30 Collectively, such traders are thought to account for over half of trading volume.31 The desire for co-location services is shared by such traders as well as buy-side brokers.32
Stock exchanges are therefore multi-product firms in that they offer trading, data, and co-location services. How we understand the competitive forces that discipline prices for each of these products depends crucially on whether stock exchanges are platforms for these services, with the demand for each being a function of developments in the others.
-
Stock Exchanges as Platforms for Trading, Data, and Co-location Services
The economics of platforms focuses on firms that act as intermediaries between two or more sets of agents.33 Common examples of platform firms are internet search engines, which bring together consumers and content providers (often advertisers), and payment card networks, which facilitate interactions between consumers and retailers. Media companies, such as newspapers, are platforms for interactions between consumers and advertisers even though consumers may primarily use the newspaper for information other than advertising.
Typically, a feature of a platform firm is that the choices of one set of agents affect the payoffs to another set of agents. For instance, when many merchants sign up to accept a payment card, the card becomes more valuable to a consumer. To the extent this benefit is not perfectly captured by prices, this feature leads to an externality that runs from one side of the platform to the other, and often in both directions.
The “sides” of a market served by platforms need not be distinct sets of agents, such as merchants and cardholders or advertisers and newspaper readers. For example, sports card conventions are two-sided platforms that bring together enthusiasts to buy and sell sports cards.34 Some participants pay an entrance fee whereas some, the dealers, pay a table fee, which allows them to set up a table at the convention. We can think of the convention as a platform that brings together these participants. While we might think of dealers as the “sellers” and regular entrants as the “buyers,” in practice both sets of agents buy, sell, and trade cards with each other. Some participants may substitute between being a dealer and non-dealer based on the convention fees.
Understanding competition in platform markets requires an analysis of how prices to all sides of the market are interrelated.35 For example, even if competition between platforms is intense and overall profits are low, it could be that prices are relatively high on one side of the market and low or even negative on the other side.36 In such a situation, analyzing competition on one side of the market in isolation can lead to incorrect conclusions.
For instance, sports card conventions typically charge much higher fees to dealers than to regular participants.37 An analyst focusing only on table fees at sports card conventions might conclude that convention organizers have market power, whereas an analyst considering both sides might conclude that the convention organizers do not have market power. Policy decisions based on overly narrow analyses can have unintended consequences; for example, regulating table fees could lead to reduced benefits such as free parking or “door prizes” (i.e., gifts for attendees) for non-dealer enthusiasts.
Stock exchanges are classic examples of platform firms. In fact, there are multiple senses in which exchanges are platforms: Some studies reference stock exchanges’ role in bringing together buyers and sellers of shares38 or providers and takers of liquidity.39 Stock exchanges can succeed only if they attract both buyers and sellers and both providers and takers of liquidity.
Stock exchanges are also platforms for trading and data. Traders’ choices about where to trade affect the value of these data products. Trading activity and order book depth enhance the informational content of the data; the best bid and offer change more frequently and there are more orders beyond the top of the book. The effect of trading activity on the value of data is one set of linkages between “sides” of the market that make stock exchanges platforms for data and trading.
Hendershott, Rysman, and Schwabe (2021) show that externalities also run in the reverse direction, from data purchases to trading. As traders buy more market data from a particular exchange, the overall volume of trading on that exchange can increase. This is because traders use market data to make order routing decisions (among other uses). That is, the information in market data is input to traders’ decisions about where to send their orders.
Market data can enter these decisions in a variety of ways, but a common theme is that market data reduces uncertainty about the price, likelihood, or timing of execution for an order. By reducing the uncertainties around order execution on an exchange, market data makes trading on that exchange more attractive to traders.
Hendershott, Rysman, and Schwabe (2021) test for these linkages between data purchases and trading activity by studying the 2015 introduction of a new data product reporting detailed information on the evolution of the order book on the NYSE—the NYSE Integrated Feed. We find that NYSE’s share of overall trading increased following the introduction of the NYSE Integrated Feed.
Proportion of U.S. Equities Trading Volume on NYSE before and after Launch of NYSE Integrated Feed, April 2013 to March 2017
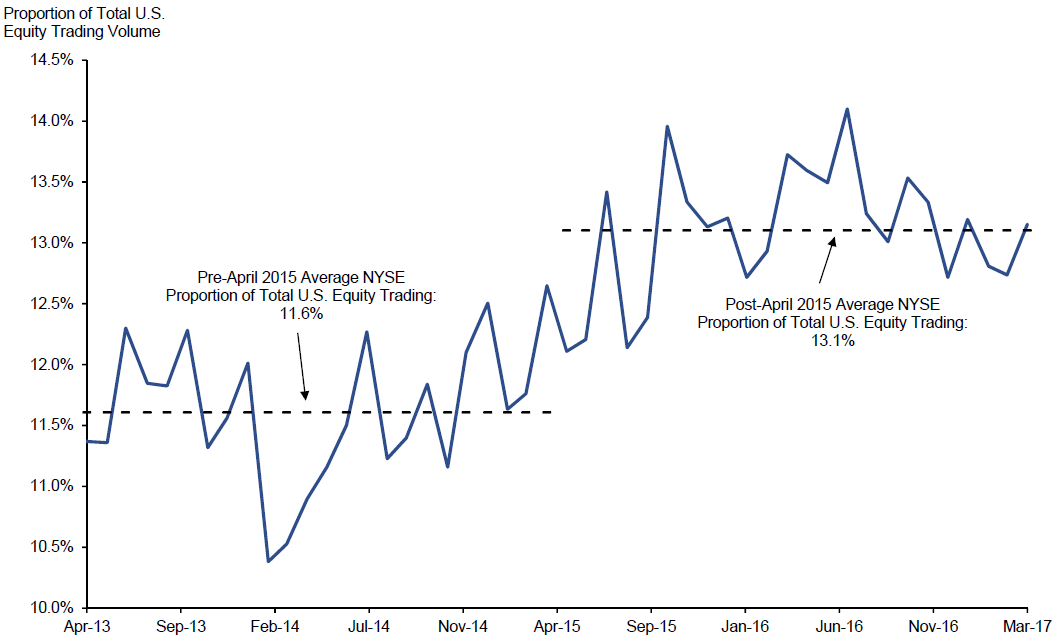
Source: Hendershott, Rysman, and Schwabe (2021)
Note: The first firms to subscribe to the NYSE Integrated Feed and trade on NYSE started doing so in April 2015.
Hendershott, Rysman, and Schwabe (2021) also find that, controlling for other factors, both firms that purchased the new NYSE Integrated Feed data product and those that did not increased their trading on NYSE. The latter result is particularly interesting from the perspective of platform economics because it suggests that firms that did not purchase the NYSE Integrated Feed product nonetheless benefited from the increased trading activity on NYSE by firms that did purchase it. This result also suggests that the liquidity externalities (benefits of having more trading by NYSE Integrated Feed purchasers) outweigh any negative externalities that could come from having a group of better-informed firms trading on NYSE; were the opposite true, one would expect order flow from non-subscribers to decrease.
This research builds on other studies of the effects of information on trading activity that also support the view that data and trading are linked through externalities.40 A particularly clear empirical case study documenting the relationship between the availability of market data and trading activity is the decision by Island ECN (an ATS) in September 2002 to “go dark” by ceasing to display its limit order book for three exchange-traded funds (ETFs).41 Hendershott and Jones (2005) document that trading volume on the Island ECN dropped following its “going dark,” but that a considerable amount of trading activity continued to take place on Island.
It seems likely that externalities also link co-location to trading and data.42 Market participants that use co-location services pursue a variety of trading strategies including market making—proprietary trading firms that engage in market making have largely replaced other types of liquidity providers such as exchange specialists.43 Thus, to the extent that co-location gives market makers increased confidence to post bids and offers, an exchange is likely to see increased liquidity and tighter bid-ask spreads, which will attract other traders. This is one source of externalities linking co-location and trading.
Co-location is likely also linked to data through externalities. One set of linkages would run through trading: if uptake of co-location services encourages trading, this would make the exchange’s data more valuable (as it reflects more trading activity and order posting). Similarly, if uptake of data products leads to increased trading activity, this would tend to make an investment in co-location more attractive. Co-location and data are also directly linked. Co-located market participants, who are often otherwise heavily invested in hardware and software that optimizes their trading activities in distinct ways from being co-located and purchasing proprietary data, can make trading decisions based on market data more quickly. The ability to make better use of market data, in turn, makes investing in co-location more attractive.
That trading, data, and co-location are linked through externalities means that competitive conditions in all three must be considered jointly in order to understand competition among stock exchanges. This has been recognized by the SEC in its regulatory review of stock exchange fees, as we explain in the following section.
-
Platform Competition and the Regulation of Stock Exchange Fees
Every change in a stock exchange’s pricing schedule, including fees for trading, data, or co-location, must be filed publicly with the SEC, and the SEC has the authority to reject those fees. Per the Securities Exchange Act of 1934, the SEC is responsible for ensuring that all exchange fees are “fair and reasonable” and “not unreasonably discriminatory.”44 Fee changes can be contested by market participants under these provisions.
There are several ways to show that fees are “reasonable.” The SEC and the courts have acknowledged that there can be a “market-based” test of reasonableness considering “whether the exchange was subject to significant competitive forces in setting the terms of its [fees].”45 Platform considerations, that is, the analysis of competition for related services, can be part of such an assessment.
The application of platform competition to the analysis of stock exchange fees can be traced to the long-running dispute over NYSE Arca’s 2006 proposed rule change to increase fees on its ArcaBook data product.46 The SEC approved the proposed fee increase in 2008 on the basis that competitive forces, including competition for order flow, constrained NYSE Arca’s prices for data products.47 The SEC, in that order, noted that
[a]ttracting order flow and distributing market data, however, are in fact two sides of the same coin and cannot be separated. . . . An exchange’s ability to attract order flow determines whether it has market data to distribute, while the exchange’s distribution of market data significantly affects its ability to attract order flow.48
An appeal to the U.S. Court of Appeals for the D.C. Circuit by two industry associations, NetCoalition and the Securities Industry and Financial Markets Association (SIFMA), led to a reversal of the SEC’s order, with the D.C. Circuit holding that it is not that “wide dissemination of market data cannot increase order flow but rather that it is not necessarily so” and arguing that more information was needed.49 Thus, the courts have left the door open for a platform competition-based approach to evaluating the reasonableness of fees.
The potential role of platform theory in evaluating the reasonableness of proposed fees is reflected in 2019 SEC staff guidance, which explains that platform theory “provides a potential pathway to demonstrating a competitive environment.”50 The staff guidance endorses the analysis of the “aggregate return across multiple product lines, such as transactions, market data, connectivity, and access” provided that the applicant can provide “evidence demonstrating that [platform] theory applies in fact to the fee at issue.”51
NYSE National’s application to introduce fees for the NYSE Integrated Feed data product, which it had previously offered free of charge, was a recent test case for the role of platform theory in the SEC’s rule approval process. NYSE National advanced several arguments for the reasonableness of its proposed fee, including a prominent case that competition for order flow would discipline market data fees as stock exchanges engage in platform competition.52 Although the SEC ultimately approved the proposed fee, it did not credit NYSE’s arguments of platform competition, saying that “[t]he Commission reaches that conclusion, however, without agreeing with or otherwise relying on the arguments made by NYSE National that exchanges function as platforms between consumers of market data and consumers of trading services.”53 While the order also states that “platform-based competition could potentially provide a basis for demonstrating significant competitive forces with regard to pricing market data,” the SEC found other grounds for approving this application and asserted that more information would be required to credit platform competition arguments.
In conclusion, the economics of platform competition have become an important part of the SEC’s framework for evaluating stock exchange fees. This is the result of an early recognition of the interaction between competition for order flow and data sales, followed by years of litigation. Yet, despite the prominent role of platform competition in these proceedings, the SEC has yet to accept platform competition as the primary basis for a fee change approval and, consequently, the contours of an analysis of platform competition that would satisfy the SEC are not yet well-defined. To the best of our knowledge, platform competition arguments have not yet been advanced in relation to applications for changes to co-location fees.
The views expressed in this article are solely those of the authors, who are responsible for the content, and do not necessarily represent the views of Cornerstone Research. This article was first published by Concurrences.
Endnotes
1 Evans, David S. and Richard Schmalensee. 2011. “The Industrial Organization of Markets with Two-Sided Platforms.” In Platform Economics: Essays on Multi-Sided Businesses, edited by David S. Evans, Competition Policy International, p. 5.
2 See, e.g., Menkveld, Albert. 2016. “The Economics of High-Frequency Trading: Taking Stock.” Annual Review of Financial Economics, 8: 1–24, p. 2.
3 “Staff Report on Algorithmic Trading in U.S. Capital Markets,” U.S. Securities and Exchange Commission, August 5, 2020, p. 13.
4 “Staff Report on Algorithmic Trading in U.S. Capital Markets,” U.S. Securities and Exchange Commission, August 5, 2020, p. 13.
5 Exchange Act Section 11A(c)(1)(C) & (D), 15 U.S.C. § 78k-1(c)(1)(C) & (D).
6 Opinion of the Commission in the Matter of the Application of Securities Industry and Financial Markets Association for Review of Action Taken by NYSE Arca, Inc., and Nasdaq Stock Market LLC, U.S. Securities and Exchange Commission, Release No. 84432, October 16, 2018, p. 22.
7 “Listing Standards,” U.S. Securities and Exchange Commission, accessed September 27, 2021.
8 ATS and dark pools are trading venues that are not regulated as registered stock exchanges. Dark pools do not provide their best-priced orders for inclusion in the consolidated quotation data that is widely distributed to the public. Broker-dealer internalizers execute trades internally, without routing orders to other trading venues in most cases. Broker-dealer internalizers execute most equity trades made by retail investors. See “Concept Release on Equity Market Structure,” U.S. Securities and Exchange Commission, Release No. 34-61358, January 14, 2010, pp. 18–21.
9 The New York Stock Exchange or “NYSE” is a subsidiary of Intercontinental Exchange (ICE) and operates NYSE, NYSE Arca, NYSE National, NYSE American, and NYSE Chicago; NASDAQ operates NASDAQ, NASDAQ BX (formerly the Boston Stock Exchange), and NASDAQ PSX (formerly the Philadelphia Stock Exchange); Cboe operates BYX Equities and BZX Equities (formerly the BATS exchanges) as well as EDGA Equities and EDGX Equities (formerly Direct Edge).
10 “U.S. Equities Market Volume Summary,” Cboe, accessed September 21, 2021. Shares reported are month-to-date as of access date.
11 The Members Exchange (MEMX), MIAX Pearl, and the Long Term Stock Exchange (LTSE) started operations in the past year. See “Celebrating Year One with Record 4% Market Share,” MEMX, September 21, 2021; “MIAX PEARL Equities Completes First Day of Live Trading,” MIAX Press Release, September 29, 2020, “The Long-Term Stock Exchange Goes Live,” LTSE Press Release, September 9, 2020. The Investors Exchange (IEX) started operations as an ATS in 2013 and launched as a stock exchange in 2016. See “Our Story,” IEX, accessed September 27, 2021.
12 “Alternative Trading Systems with Form ATS on File with the SEC as of February 29, 2020,” U.S. Securities and Exchange Commission.
13 Stock exchanges also charge membership fees. Only member firms can trade on an exchange.
14 “Transaction Fee Pilot, Final Rule,” U.S. Securities and Exchange Commission, February 20, 2019, p. 5.
15 “Transaction Fee Pilot, Final Rule,” U.S. Securities and Exchange Commission, February 20, 2019, p. 5.
16 Stock exchanges may also provide other incentives to attract market makers. For example, NYSE’s Designated Market Maker program offers rebates for certain market making activities while imposing requirements designed to improve liquidity and reduce volatility. See “Designated Market Makers,” New York Stock Exchange, accessed September 27, 2021.
17 Per Rule 610(c) of Regulation NMS. See “Concept Release on Equity Market Structure,” U.S. Securities and Exchange Commission, Release No. 34-61358, January 14, 2010, p. 17; “Transaction Fee Pilot, Final Rule,” U.S. Securities and Exchange Commission, February 20, 2019, p. 217.
18 Budish, Eric, Robin S. Lee, and John J. Shim. 2019. “Will the Market Fix the Market? A Theory of Stock Exchange Competition and Innovation.” National Bureau of Economic Research Working Paper 25855. See also Colliard, Jean-Edouard, and Thierry Foucault. 2012. “Trading Fees and Efficiency in Limit Order Markets." The Review of Financial Studies 25(11): 3389–3421, p. 3390 (“[C]ompetition among markets has triggered a sharp decline in trading fees.”).
19 Hendershott, Terrence, Marc Rysman, and Rainer Schwabe. 2021. “Stock Exchanges as Platforms for Data and Trading.” Manuscript, fn 35.
20 Budish, Eric, Robin S. Lee, and John J. Shim. 2019. “Will the Market Fix the Market? A Theory of Stock Exchange Competition and Innovation.” Manuscript, p. 27 (referring to trading fees as “perfectly competitive”); Colliard, Jean-Edouard, and Thierry Foucault. 2012. “Trading Fees and Efficiency in Limit Order Markets." The Review of Financial Studies 25(11): 3389–3421, p. 3390 (“competition among markets has triggered a sharp decline in trading fees”).
21 Jones, Charles. 2018. “Understanding the Market for US Equity Market Data.” Manuscript, p. 7.
22 Jones, Charles. 2018. “Understanding the Market for US Equity Market Data.” Manuscript, p. 7. Consolidated feed data are being updated to include additional information, including a limited amount of depth of book information. The reforms also foresee multiple consolidators distributing these data. See “SEC Adopts Rules to Modernize Key Market Infrastructure Responsible for Collecting, Consolidating, and Disseminating Equity Market Data,” U.S. Securities and Exchange Commission, December 9, 2020.
23 “Providing Stock Quotations to Customers,” FINRA Regulatory Notice 15-52, December 2015, p. 1, (“FINRA is issuing this Notice to remind firms and registered representatives of their obligations under Rule 603(c) of Regulation NMS (Vendor Display Rule) when providing quotation information to customers. The SEC staff recently made clear its view that if a registered representative provides a quotation to a customer that can be used to assess the current market or the quality of trade execution, reliance on non-consolidated market information as the source of that quotation would not be consistent with the Vendor Display Rule. In light of the SEC staff’s statements, firms should review whether they are in compliance with the requirement in the Vendor Display Rule that broker-dealers provide a consolidated display of market data when they are providing quotation information to customers.”).
24 Proprietary data products can be classified as: (1) Best bid or offer (BBO): Shows the best prices available at the exchange, and the quantities available at these prices. This provides the same data as the SIP, but only for the single exchange in question. (2) Order book: Shows quantities available at each price level at and beyond the top of the book. Order book products often include information on odd lot orders. (3) Full order-by-order depth of book: Shows order book information along with detailed information about the nature of each adjustment to the order book. That is, it provides data on each trade, new order, order cancelation, or order modification, providing additional detail about movements in the order book. (4) Order imbalance: Information about aggregate quantities and prices submitted during auction periods. (5) Trade data: Reports all transactions executed on the exchange. This information is also reported in the SIP.
25 The median data bill in December 2018 for firms that both traded and purchased proprietary data from NYSE was $5,580. See Hendershott, Terrence, Marc Rysman, and Rainer Schwabe. 2021. “Stock Exchanges as Platforms for Data and Trading.” Manuscript, p. 10.
26 “Market Data Pricing,” NYSE, January 1, 2018, p. 19; “Price List – U.S. Equities,” NasdaqTrader.com; “Cboe Data Services, Market Data Product Price List,” Cboe, July 25, 2018.
27 “Self-Regulatory Organizations: Notice of Filing and Immediate Effectiveness of Proposed Rule Change by NYSE Arca, Inc. Relating to Fees for NYSE Arca Depth-of-Book Data,” Securities Exchange Act Release No. 34-63291, November 9, 2010, pp. 7–8; John McCrank, “BATS Exchanges to Start Charging for Market Data,” Reuters, April 18, 2013; “Self-Regulatory Organizations; BATS Exchange, Inc.; Notice of Filing and Immediate Effectiveness of a Proposed Rule Change to Impose Fees for Market Data,” Securities Exchange Act Release No. 34-69936, July 3, 2013, pp. 1–25.
28 “Concept Release on Equity Market Structure,” U.S. Securities and Exchange Commission, Release No. 34-61358, January 14, 2010, p. 53.
29 GETCO, Letter to the SEC Commenting on Release No. 61358, April 27, 2010, pp. 3, 10 (“Co-location is a new manifestation of a centuries old principle, as certain traders have always sought proximity to the center of trading, whether it is an exchange’s trading floor or an exchange’s data center.”)
30 “Concept Release on Equity Market Structure,” U.S. Securities and Exchange Commission, Release No. 34-61358, January 14, 2010, pp. 46–57.
31 O’Hara, Maureen. 2015. “High Frequency Market Microstructure.” Journal of Financial Economics 116(2): 257–270, p. 258.
32 GETCO, Letter to the SEC Commenting on Release No. 61358, April 27, 2010, pp. 9–10 (“Most brokers, including institutional and retail, are either co-located themselves or access the market through a member firm that is co-located.”).
33 The discussion in this section draws from Rysman, Marc. 2009. “The Economics of Two-Sided Markets.” Journal of Economic Perspectives 23(3): 125–143.
34 Jin, Ginger Zhe, and Marc Rysman. 2015. “Platform Pricing at Sports Card Conventions.” The Journal of Industrial Economics 63(4): 704–735.
35 Evans, David. 2011. “Two-Sided Antitrust Economics.” In Platform Economics: Essays on Multi-Sided Businesses, edited by David S. Evans, Competition Policy International.
36 Evans, David. 2011. “Two-Sided Antitrust Economics.” In Platform Economics: Essays on Multi-Sided Businesses, edited by David S. Evans, Competition Policy International, p. 116.
37 Jin, Ginger Zhe, and Marc Rysman. 2015. “Platform Pricing at Sports Card Conventions.” The Journal of Industrial Economics 63(4): 704–735.
38 Although market participants may be willing to switch between being a buyer and seller of a given security as the price changes, within any trade, an exchange is matching a buyer to a seller. In general, sellers prefer markets with many buyers and buyers prefer markets with many sellers, which generates a platform dynamic. See, Evans, David S. and Richard Schmalensee. 2011. “The Industrial Organization of Markets with Two-Sided Platforms.” In Platform Economics: Essays on Multi-Sided Businesses, edited by David S. Evans, Competition Policy International, p. 5 (“Exchanges have two groups of customers, who can generally be considered ‘buyers’ and ‘sellers.’ The exchange helps buyers and sellers search for feasible contracts—that is where the buyer and seller could enter into a mutually advantageous trade.”).
39 U.S. stock exchanges are organized as central limit order books, in which traders post offers to buy or sell at a particular price. Traders that post non-marketable limit orders (i.e., buy/sell limit orders with a limit price below/above current interest on the opposite side) are referred to as providers of liquidity. Traders that take those offers by submitting market orders (to buy/sell at the best available price) or marketable limit orders (where the buy/sell limit price is at or above/below current interest on the other side) are takers of liquidity. A provider of liquidity may be either a buyer or seller of the stock (and similarly for liquidity takers). See, Evans, David S. and Richard Schmalensee. 2011. “The Industrial Organization of Markets with Two-Sided Platforms.” In Platform Economics: Essays on Multi-Sided Businesses, edited by David S. Evans, Competition Policy International, p. 5 (“In organized exchanges such as the New York Stock Exchange, it is often more useful to think of the two sides as liquidity providers—specialists or market-makers who quote prices to both buyers and sellers and thus bring liquidity to the market—and liquidity consumers—ordinary customers who accept liquidity providers’ offers.”); Foucault, Thierry, Ohad Kadan, and Eugene Kandel. 2013. “Liquidity Cycles and Make/Take Fees in Electronic Markets.” Journal of Finance, 68(1): 299–341, p. 300 (“Our model is designed to analyze the determinants of this rate when market monitoring is costly. It features a trading platform with two types of traders: ‘market makers,’ who post quotes, and ‘market takers,’ who hit quotes.”).
40 Boehmer et al. (2005) study the introduction of NYSE’s OpenBook product in January 2002 and find that it had positive effects on trading activity on NYSE’s electronic limit order book, shifting trading from NYSE’s floor brokers. See Boehmer, Ekkehart, Gideon Saar, and Lei Yu. 2005. “Lifting the Veil: An Analysis of Pre-Trade Transparency at the NYSE.” Journal of Finance 60(2): 783–815.
41 Hendershott, Terrence and Charles M. Jones. 2005. “Island Goes Dark: Transparency, Fragmentation, and Regulation.” Review of Financial Studies 18(3): 743–793.
42 We are not aware of research studying these linkages.
43 “Concept Release on Equity Market Structure,” U.S. Securities and Exchange Commission, Release No. 34-61358, January 14, 2010, p. 48–53.
44 Exchange Act Section 11A(c)(1)(C) & (D), 15 U.S.C. § 78k-1(c)(1)(C) & (D). See also Rule 603(a) of Regulation NMS, 17 C.F.R. § 242.603(a) (same).
45 Court Opinion in NetCoalition v. Securities and Exchange Commission, U.S. Court of Appeals for the District of Columbia Circuit, Case No. 09-1042 (“NetCoalition I”), August 6, 2010, pp. 11–12.
46 Filing of Proposed Rule Change Relating to Approval of Market Data Fees for NYSE Arca Data, SEC Release No. 34-53952,71 FR 33496, June 9, 2006.
47 “Self-Regulatory Organizations; NYSE Arca, Inc.; Order Setting Aside Action by Delegated Authority and Approving Proposed Rule Change Relating to NYSE Arca Data,” Securities Act Release No. 34-59039, December 2, 2008; 73 FR 74770, December 9, 2008.
48 “Self-Regulatory Organizations; NYSE Arca, Inc.; Order Setting Aside Action by Delegated Authority and Approving Proposed Rule Change Relating to NYSE Arca Data,” Securities Act Release No. 34-59039, December 2, 2008; 73 FR 74770, December 9, 2008, at 74783.
49 NetCoalition I, August 6, 2010, p. 26.
50 “Staff Guidance on SRO Rule Filings Relating to Fees,” U.S. Securities and Exchange Commission, May 21, 2019.
51 “Staff Guidance on SRO Rule Filings Relating to Fees,” U.S. Securities and Exchange Commission, May 21, 2019.
52 “Notice of Filing and Immediate Effectiveness of Proposed Rule Change to Establish Fees for the NYSE National Integrated Feed,” File no. SR-NYSENAT-2019-31, December 18, 2019, pp. 18–25.
53 “Order Approving a Proposed Rule Change to Establish Fees for the NYSE National Integrated Feed,” U.S. Securities and Exchange Commission, Release No. 34-90217, October 16, 2020.